Dear all,
I am trying to visualize a pie chart using one of my custom timestamp columns available in my custom log which has the format YYYY-MM-DD-HH:MM:SS (example 2020-02-18-00:13:17).
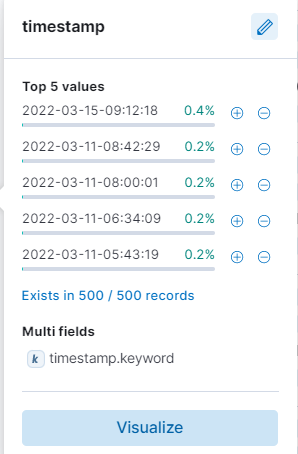
However "create visualizations" does not consider my custom timestamp.keyword column as a valid timestamp using which I can create a date range graph:

As you can see, it does not take any other option for date range split although we have timestamp.keyword in the data:
Could you please suggest any workaround for adding YYYY-MM-DD-HH:MM:SS format timestamp for date range visualizations?
Thanks and regards,
Ashiq Aboo Backer