Hi,
i try to create visualizations of my memcached-metrics collected by metricbeat. These data comes from a cluster-environment with several nodes. Each node running a set of Memcached-Pools which is determinable by its Port. I allready able to bundle these pools over all nodes by using a term-aggregation with cripted-field over metricbeats field "metricset.host" (field contains IP and Pool-Port, so i cut port from rest by substring in painless). My Attempts failing when i try to sum up datas of nodes of a pool. It seems allready the data of all documents in the time-buckets of a node are used as addend for sum of pooldata. So may somone can tell me how to define average-values in the subaggregation or define something like "use just latest value in time-bucket level" ?
I think screenshots of my setting explains my attempts a bit better...
...some docs from metricbeat...

...and a linechart with too high values, peak should be less than 100k...
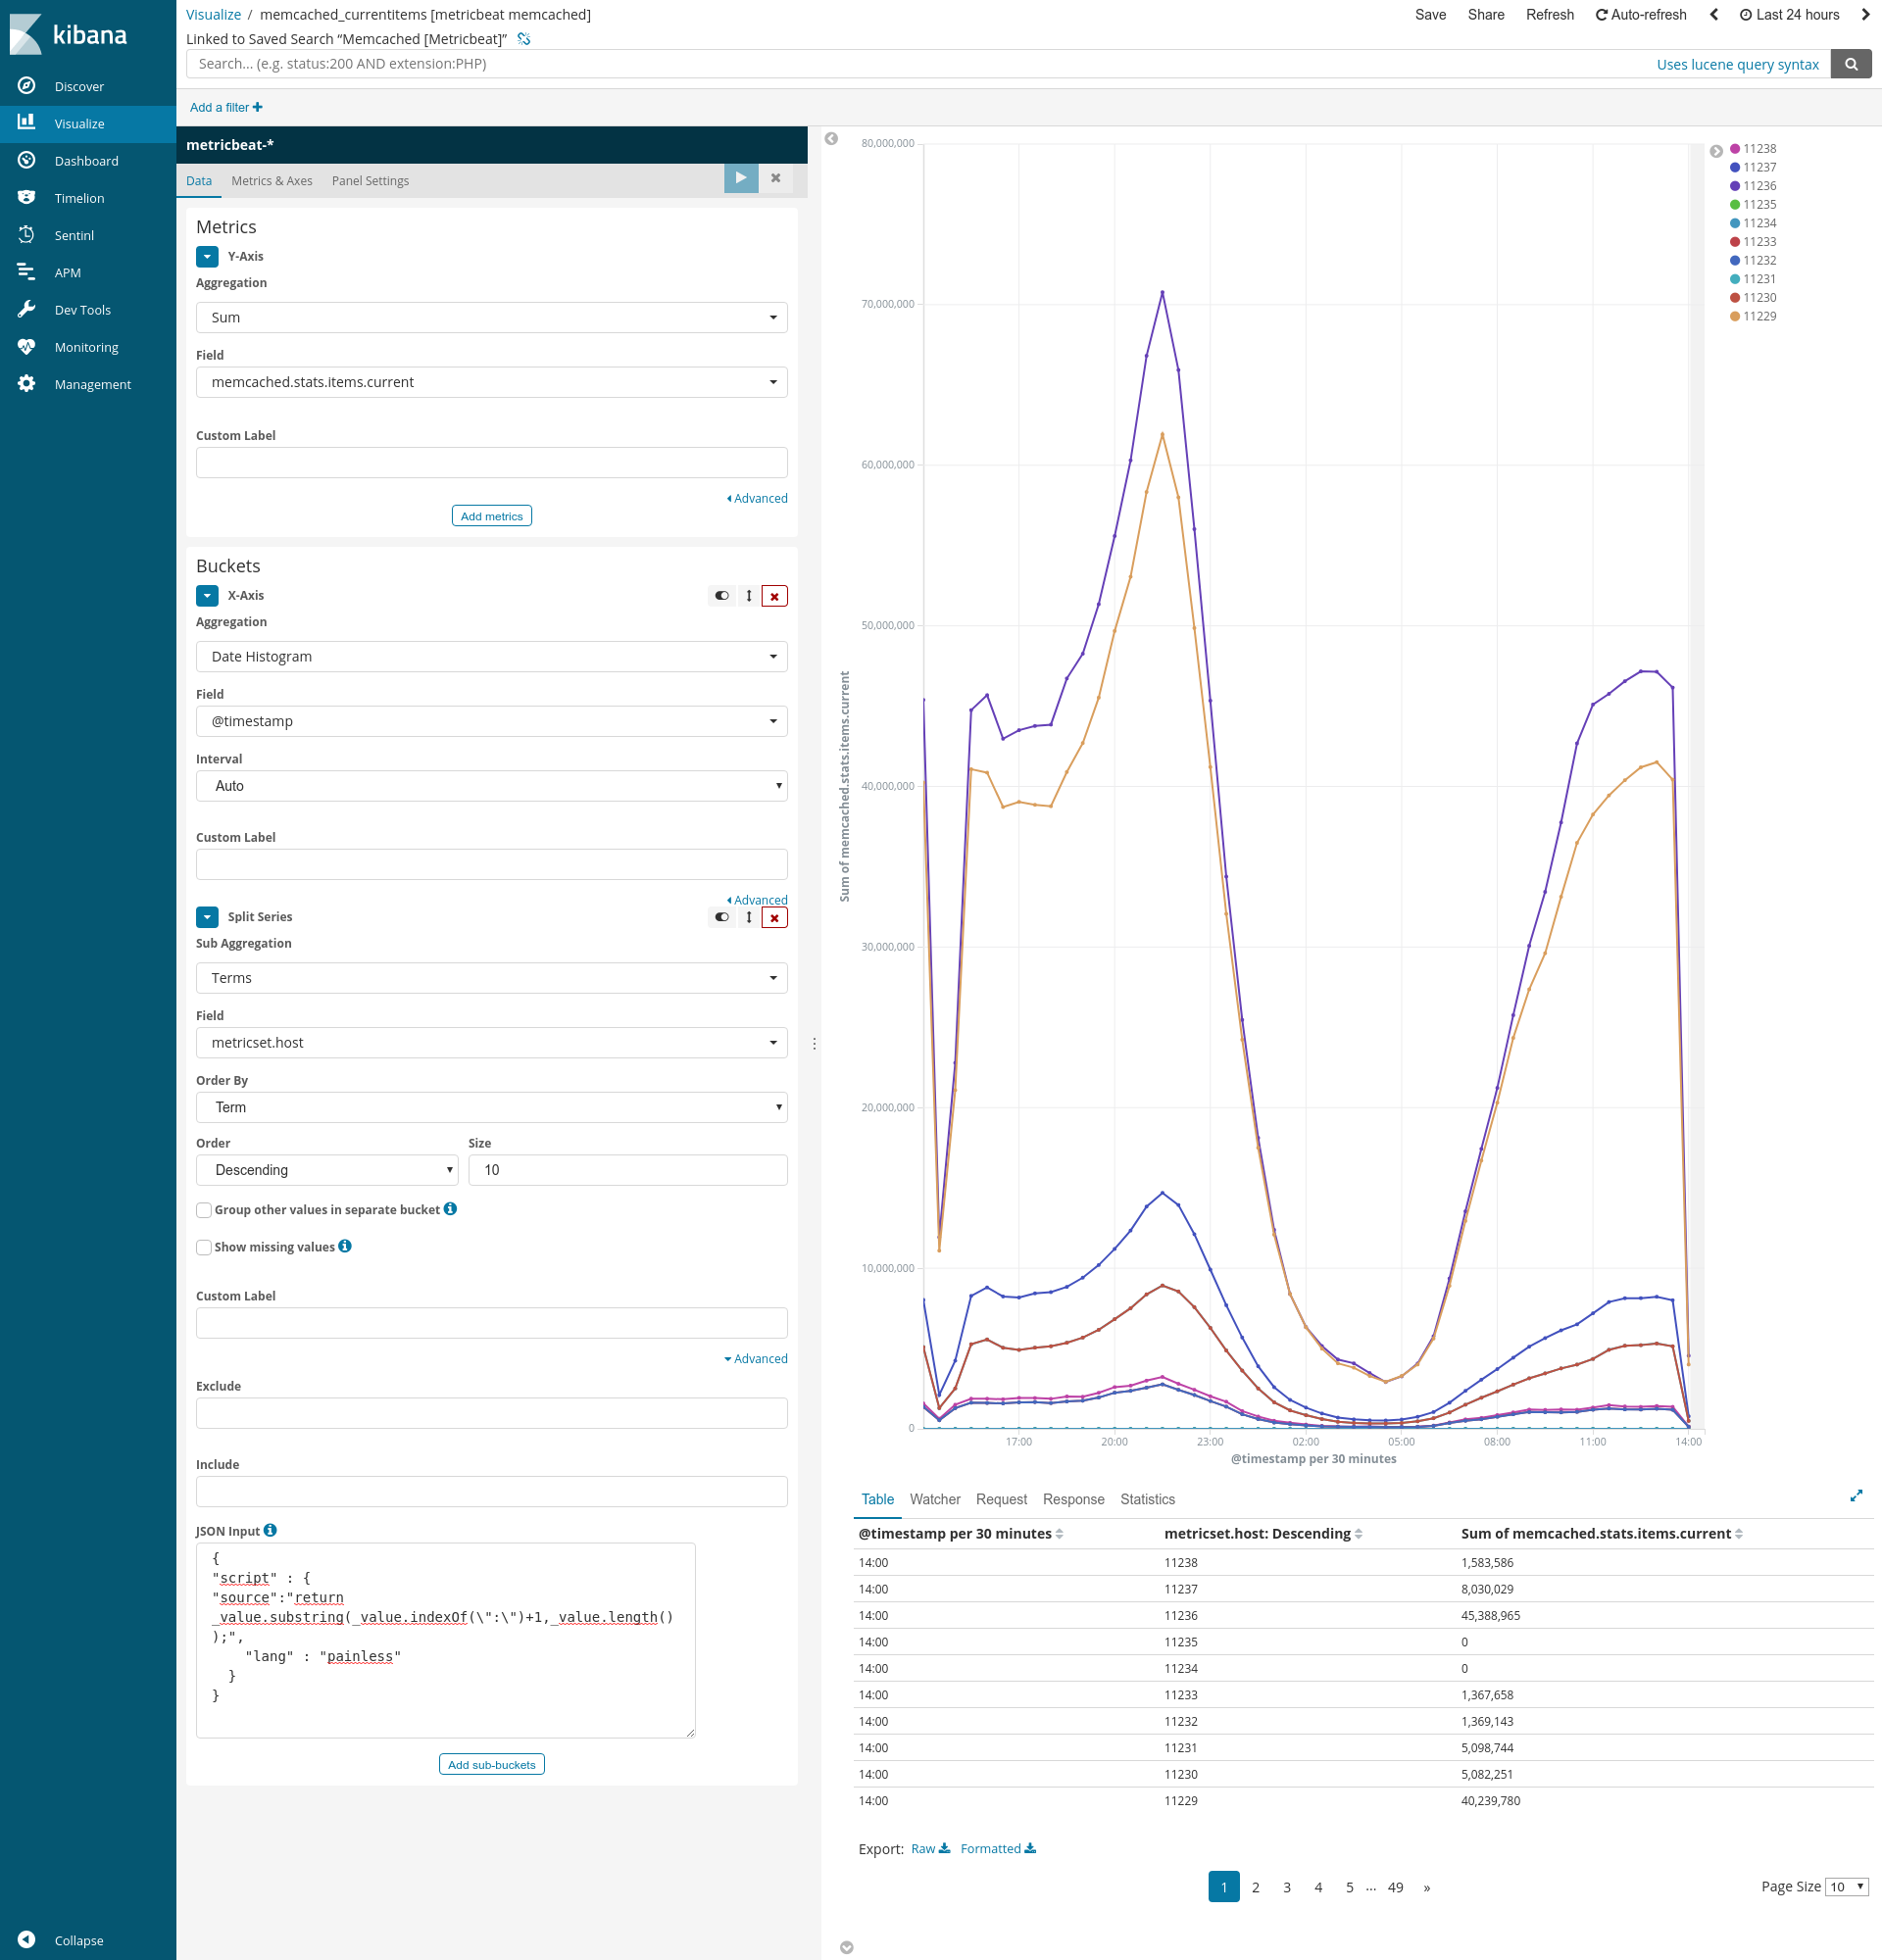
Would appreciate any help! Regards Florian