Hi,
I am trying to visualize the change of a field over time. (stupid beginner, sorry)
I am currently sending each hour a message from ~1000 devices with y unipue ID in each message
{
    	"DIAG": {
    		"Name": "Device_1",
    		"Value": "636119"
    	}
    }
Sometime the value will be changed, e.g.:
But only sometimes - the most of the message are identically.
{
	"DIAG": {
		"Name": "Device_1",
		"Value": "636111"
	}
}
What i am create is a simple list to displsy the change of "Value".
- deviceID
- ChangeTime
- OldValue
- NewValue
(over all devices)
Or also be possible a table with two lines:
==> Have anyone a idea? 
You will want to also record the timestamp of when the metric was calculated.
Here is the sample data and mapping I created as an example to work from:
PUT discuss-133555
{
  "mappings": {
    "doc": {
      "properties": {
        "DIAG": {
          "properties": {
            "Name": {
              "type": "text",
              "fields": {
                "keyword": {
                  "type": "keyword",
                  "ignore_above": 256
                }
              }
            },
            "Value": {
              "type": "integer"
            },
            "@timestamp": {
              "type": "date"
            }
          }
        }
      }
    }
  }
}

POST discuss-133555/doc
{
  "DIAG": {
    "Name": "Device_1",
    "Value": 100,
    "@timestamp": "2018-03-12T09:21:31"
  }
}

POST discuss-133555/doc
{
  "DIAG": {
    "Name": "Device_1",
    "Value": 200,
    "@timestamp": "2018-03-13T09:21:31"
  }
}

POST discuss-133555/doc
{
  "DIAG": {
    "Name": "Device_1",
    "Value": 300,
    "@timestamp": "2018-03-14T09:21:31"
  }
}

POST discuss-133555/doc
{
  "DIAG": {
    "Name": "Device_2",
    "Value": 30,
    "@timestamp": "2018-03-12T09:21:31"
  }
}

POST discuss-133555/doc
{
  "DIAG": {
    "Name": "Device_2",
    "Value": 40,
    "@timestamp": "2018-03-13T09:21:31"
  }
}

POST discuss-133555/doc
{
  "DIAG": {
    "Name": "Device_2",
    "Value": 50,
    "@timestamp": "2018-03-14T09:21:31"
  }
}
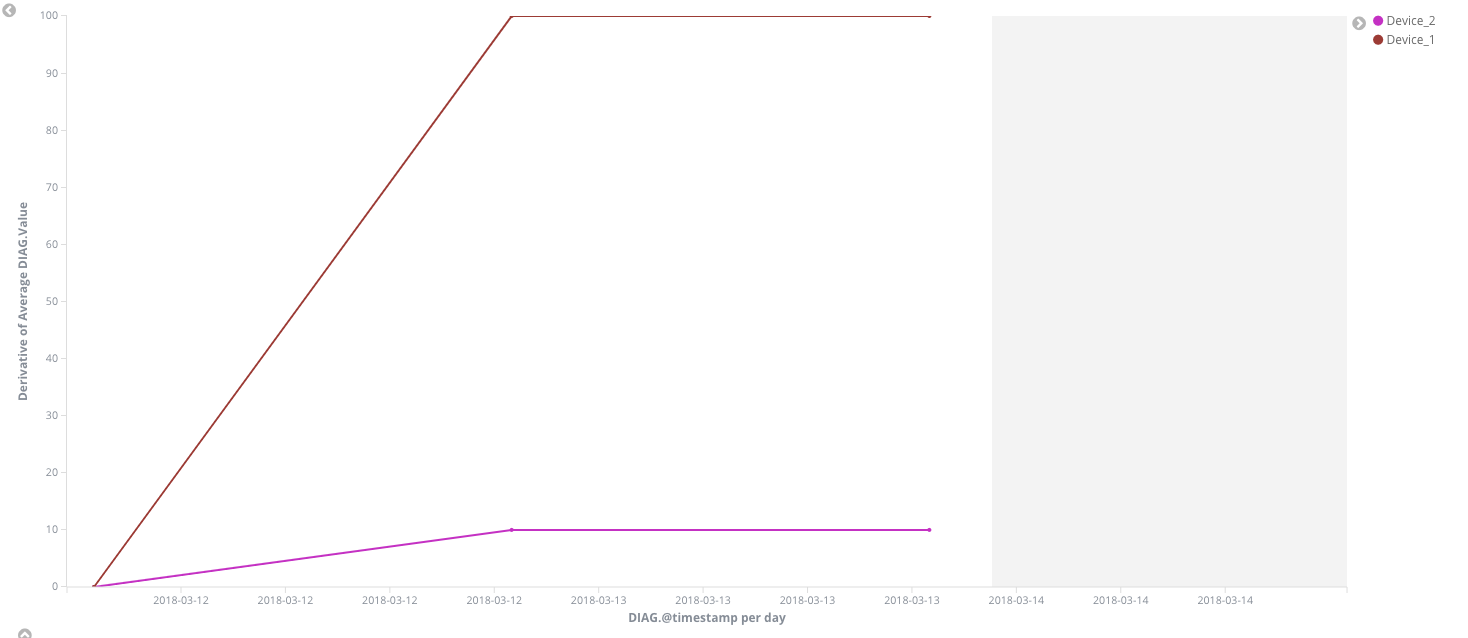
Here the value is something like disk space used. In order to graph the rate of change, I can use a derivative function to calculate the rate of change.
I then bucket it over time, and split on DIAG.Name:
This will then show me the rate of change, which is 10 per day for device_2 and 100 for device_1.
Hopefully this helps.
Hi,
sorry for the late response and thanks a lot for your reply.
Yes, the timestamp is also stored in the message.
I am looking more for a table instead of a graph and just want to visualize the last changes of this value.
The most of the time a value from one device is the same like before. But sometime this value will be changed.
POST discuss-133555/doc
{
  "DIAG": {
    "Name": "Device_1",
    "Value": 100,
    "@timestamp": "2018-03-12T09:21:31"
  }
}

POST discuss-133555/doc
{
  "DIAG": {
    "Name": "Device_1",
    "Value": 100,
    "@timestamp": "2018-03-13T09:21:31"
  }
}

POST discuss-133555/doc
{
  "DIAG": {
    "Name": "Device_1",
    "Value": 200,
    "@timestamp": "2018-03-14T09:21:31"
  }
}

POST discuss-133555/doc
{
  "DIAG": {
    "Name": "Device_1",
    "Value": 200,
    "@timestamp": "2018-03-15T09:21:31"
  }
}
i am lookling for a result like this in a table:
Device | NewValue | OldValue | Change
Device_1 | 200 | 100 | 2018-03-14T09:21:31