Hi,
I'm scraping some cross-country skiing results, ingesting it in Elasticsearch and visualizing it in Kibana. It works pretty well! Although there is one thing I would like to accomplish that I can't get my head around how to solve.
I'm pretty flexible in designing the data model, so that can be changed if needed.
Currently my model is that I create 1 document for each participant and split.
So for participant with name "William Poromaa" I have these three documents from his splits at 4.1, 4.4 and 5.7 kilometers:
{
  "col_result": "9:11.70",
  "col_result_seconds": 551.7,
  "col_name": "POROMAA William",
  "@timestamp": "2020-11-22T11:28:21+01:00",
  "split_distance": 4.1,
  "col_delta_result_seconds": 145.80000000000007
},
{
  "col_result": "10:23.20",
  "col_result_seconds": 623.2,
  "col_name": "POROMAA William",
  "@timestamp": "2020-11-22T11:30:45+01:00",
  "split_distance": 4.4,
  "col_delta_result_seconds": 71.5
},
{
  "col_result": "13:01.90",
  "col_result_seconds": 781.9,
  "col_name": "POROMAA William",
  "@timestamp": "2020-11-22T11:36:01+01:00",
  "split_distance": 5.7,
  "col_delta_result_seconds": 158.69999999999993
}
Explanations of the fields:
col_result: The skiing time as a string (Minutes:Seconds:Hundreds of seconds)
col_result_seconds: The skiing time as number of seconds
col_name: The name of the participant
@timestamp: Actual time when the participant reached the split. Based on start time of race + col_result_seconds
split_distance: The distance in kilometers skied so far
col_delta_result_seconds: The time it took from previous split to this split in seconds.
So what I would like to do now is to have a Data Table showing med a top list of the fastest skiiers between two splits. So for example, "Who skiied fastest between 4.1 and 5.7 kilometers"
What have I tried so far?
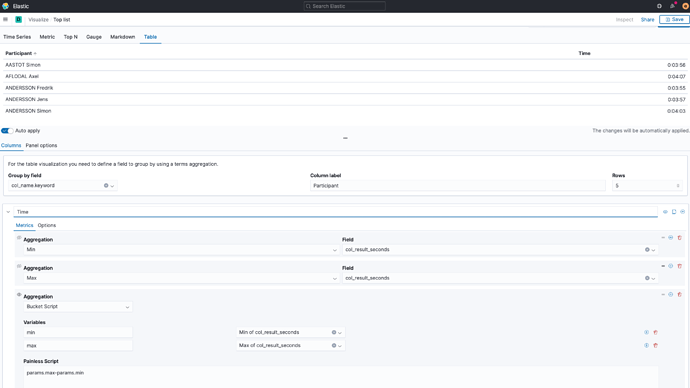
First stab was to use TSVB to create this:
- Group by col_name
- Min Aggregation on col_result_seconds
- Max Aggregation on col_result_seconds
- Bucket Script Aggregation with params.max - params.min
This actually gives me the desired results but the result is not sorted based on the Bucket Script calculation. I would have liked to use Bucket Sort Aggregation for this but it is not available in TSVB (or any Visualization i've found)
Second stab was to simply sum the delta results for each split, and then order by sum.
But this gives me wrong result. Calculating the sum of the deltas between 4.1 and 5.7 gives me 145.8 + 71.5 + 158.7 seconds. This is wrong since 145.8 is the time it took to reach 4.1 kilometers from the previous split. I'm only interested in 71.5 + 158.7
Third stab was to use Derivative Aggregation on the col_result_seconds, because bascially this is what I want. The difference in time between two points.
I've tried setting it up with a date_histogram on @timestamp or histogram on split_distance but the Derivative Aggregation uses it's own intervals. But since I need the exact intervals I cannot get this to work either.
And now I'm out of ideas. If the normal Kibana Visualizations can't handle this could it be possible to do with Vega? Or maybe Canvas?
Or can I model my data in another way?
Input from wise people are appreciated 
/Tobias

