I have set up a watcher that generates a report based on a dashboard and sends it on email as a pdf attachement.
In the PDF the x-axis labels are not visible, but they are visible on the dashboard. Why is that and how can I fix it?
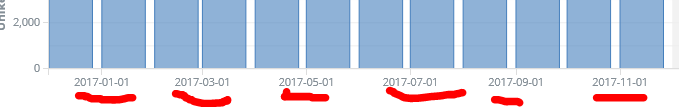
In the pdf report the labels are missing for x-axis (they are shown for y-axis):
On the dashboard the pdf is generated from the labels are visible (however only for every other month, not for every month which is what I would prefer):
I also wonder how I can set up the watcher interval to be every month (preferably the first in every month)?
you should use a cron expression for that instead of an interval, if it is so long running. The interval starts counting from zero when a master node switches or the cluster is restarted, and I am sure you want to get that report every first of the month or?
Apache, Apache Lucene, Apache Hadoop, Hadoop, HDFS and the yellow elephant
logo are trademarks of the
Apache Software Foundation
in the United States and/or other countries.