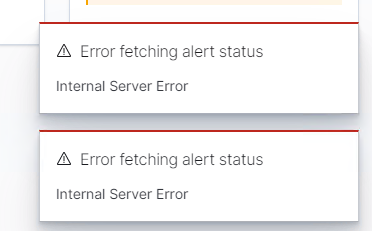
I keep getting this error in Kibana, it has some thing to do with the monitoring. Any ideas?
log [14:46:39.367] [error][http] { Error: Saved object [task/ad935fc0-1b37-11eb-b82d-4de2f86f3632] not found
at Function.createGenericNotFoundError (C:\kibana-7.9.3-windows-x86_64\src\core\server\saved_objects\service\lib\errors.js:134:37)
at SavedObjectsRepository.get (C:\kibana-7.9.3-windows-x86_64\src\core\server\saved_objects\service\lib\repository.js:783:46)
at process._tickCallback (internal/process/next_tick.js:68:7)
data: null,
isBoom: true,
isServer: false,
output:
{ statusCode: 404,
payload:
{ statusCode: 404,
error: 'Not Found',
message:
'Saved object [task/ad935fc0-1b37-11eb-b82d-4de2f86f3632] not found' },
headers: {} },
reformat: [Function],
typeof: [Function: notFound],
[Symbol(SavedObjectsClientErrorCode)]: 'SavedObjectsClient/notFound' }
error [14:46:39.320] Error: Internal Server Error
at HapiResponseAdapter.toInternalError (C:\kibana-7.9.3-windows-x86_64\src\core\server\http\router\response_adapter.js:69:19)
at Router.handle (C:\kibana-7.9.3-windows-x86_64\src\core\server\http\router\router.js:170:34)
at process._tickCallback (internal/process/next_tick.js:68:7)
log [14:46:51.338] [error][http] { Error: Saved object [task/ad935fc0-1b37-11eb-b82d-4de2f86f3632] not found
at Function.createGenericNotFoundError (C:\kibana-7.9.3-windows-x86_64\src\core\server\saved_objects\service\lib\errors.js:134:37)
at SavedObjectsRepository.get (C:\kibana-7.9.3-windows-x86_64\src\core\server\saved_objects\service\lib\repository.js:783:46)
at process._tickCallback (internal/process/next_tick.js:68:7)
data: null,
isBoom: true,
isServer: false,
output:
{ statusCode: 404,
payload:
{ statusCode: 404,
error: 'Not Found',
message:
'Saved object [task/ad935fc0-1b37-11eb-b82d-4de2f86f3632] not found' },
headers: {} },
reformat: [Function],
typeof: [Function: notFound],
[Symbol(SavedObjectsClientErrorCode)]: 'SavedObjectsClient/notFound' }
error [14:46:51.322] Error: Internal Server Error
at HapiResponseAdapter.toInternalError (C:\kibana-7.9.3-windows-x86_64\src\core\server\http\router\response_adapter.js:69:19)
at Router.handle (C:\kibana-7.9.3-windows-x86_64\src\core\server\http\router\router.js:170:34)
at process._tickCallback (internal/process/next_tick.js:68:7)