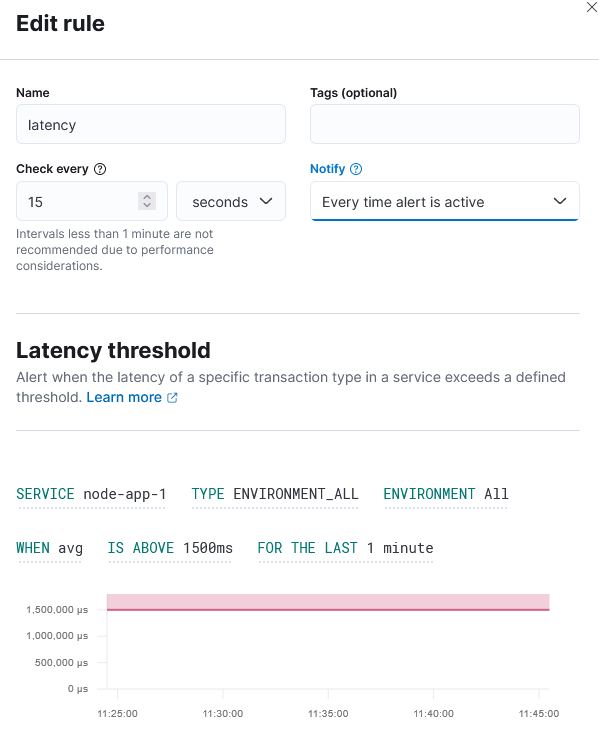
But the rule above never seems to fire at all, even though my node-app-1 service averages latency of 10 seconds, which is much greater than the 1.5s threshold specified in my rule, see image below:
I have a bash script that will ping the Kibana Rest API to capture any mention of Active alerts, which then sends an SMS to my phone. This works well for metric beat alerts and everything. It also worked fine when I use APM Error Threshold alerts. But that's only because I know how to cause those alerts to go from Ok to Active.
I jsut dont' know how to make Latency Threshold Alerts go from Ok to Active.
Perhaps You should writes the alerts to the log connector it is free and then your bash script / query could look at that... just a suggestion...then you have a nice index with the alerts in them
Apache, Apache Lucene, Apache Hadoop, Hadoop, HDFS and the yellow elephant
logo are trademarks of the
Apache Software Foundation
in the United States and/or other countries.