Hello,I'm Bob,here is my question:
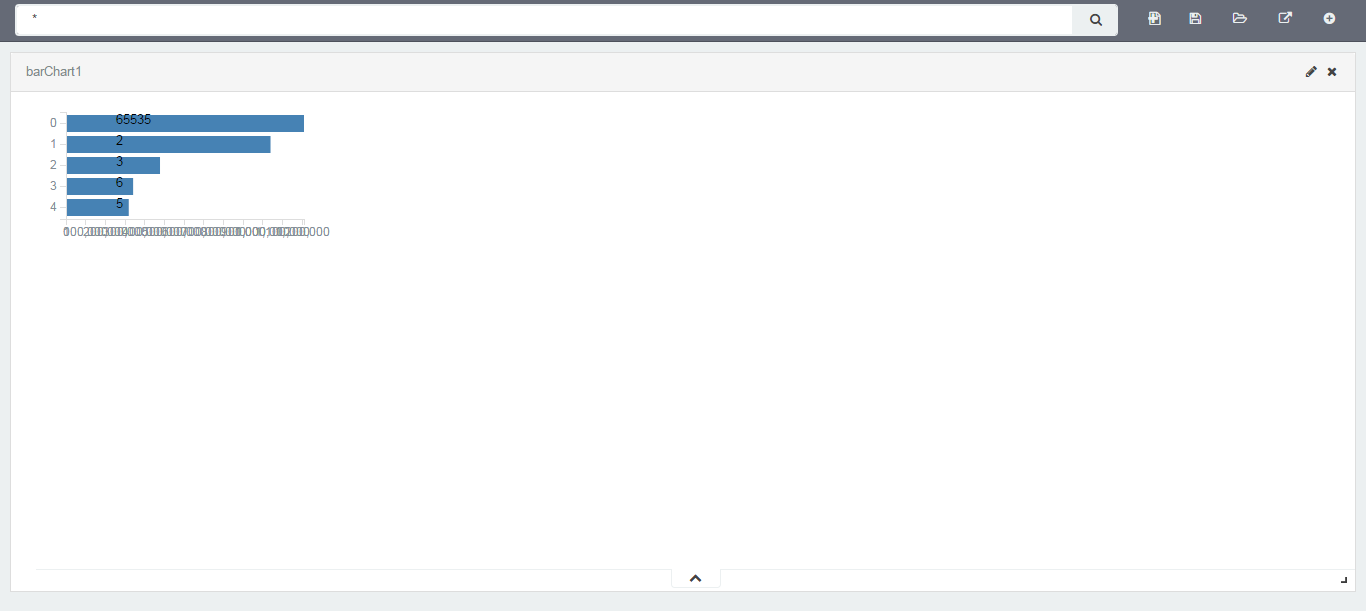
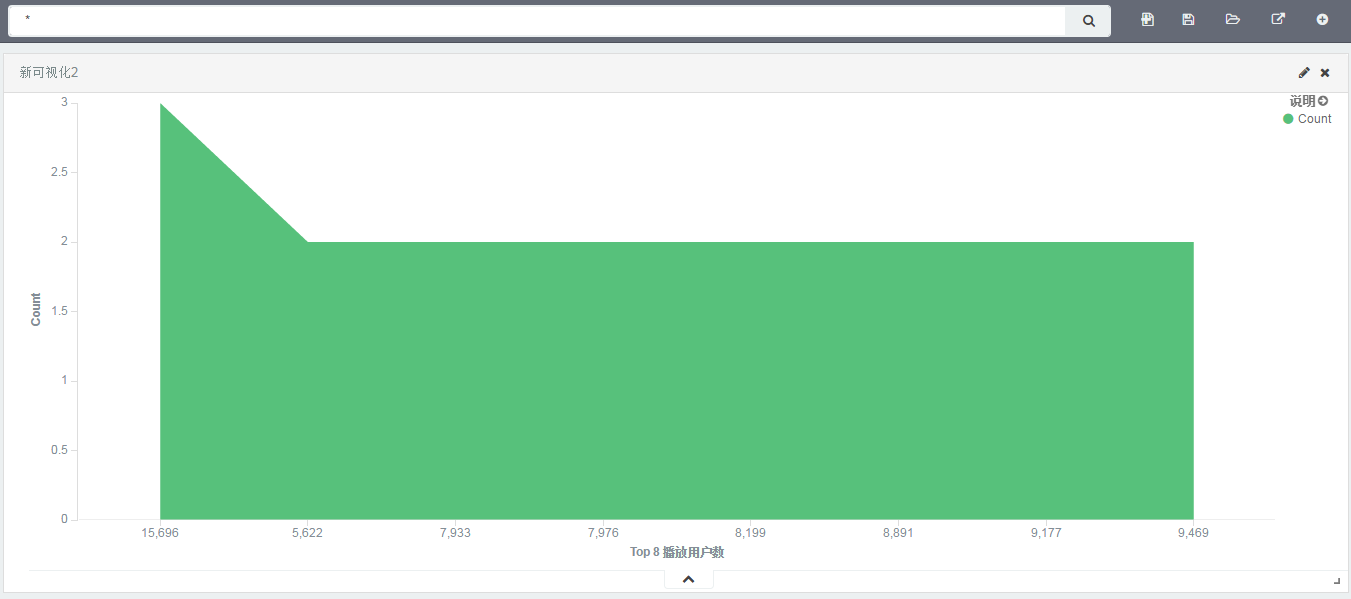
dragging before:

dragging after:
kibana version:4.1.2
I want to know which folder or file is in charge of adjusting the chart‘s size when draged.Thank you for your help.
The closest is probably this one. Kibana uses gridster for handling dashboard visualizations.
Thank you Jon! My boss ask me to add new chart to kibana plugin , and I imitated bar chart according meitric_vis. But the result is that new chart can't resize when I save the visualization and show it in dashboard.Just like the screenshot I show.
Sorry I don't think I'm following. It can't resize in what way, are you expecting more data to show? Visualizations also have a resize checker here.
Here is the problem I can't solve.
First: I added bar chart imitate metric_vis.
© 2020. All Rights Reserved - Elasticsearch
Apache, Apache Lucene, Apache Hadoop, Hadoop, HDFS and the yellow elephant logo are trademarks of the Apache Software Foundation in the United States and/or other countries.