Hello. Below is the results of an elasticsearch. Note the query, and the time range. The bars come in roughly 4 clusters. Note also the x-axis and the @timestamps per 5 minutes.

Now, for values in the elastic search entries, I wanted to create a graph of values over time. I used the datehistogram and selected an aggregate function for the value I wanted to plot. Below is the results.
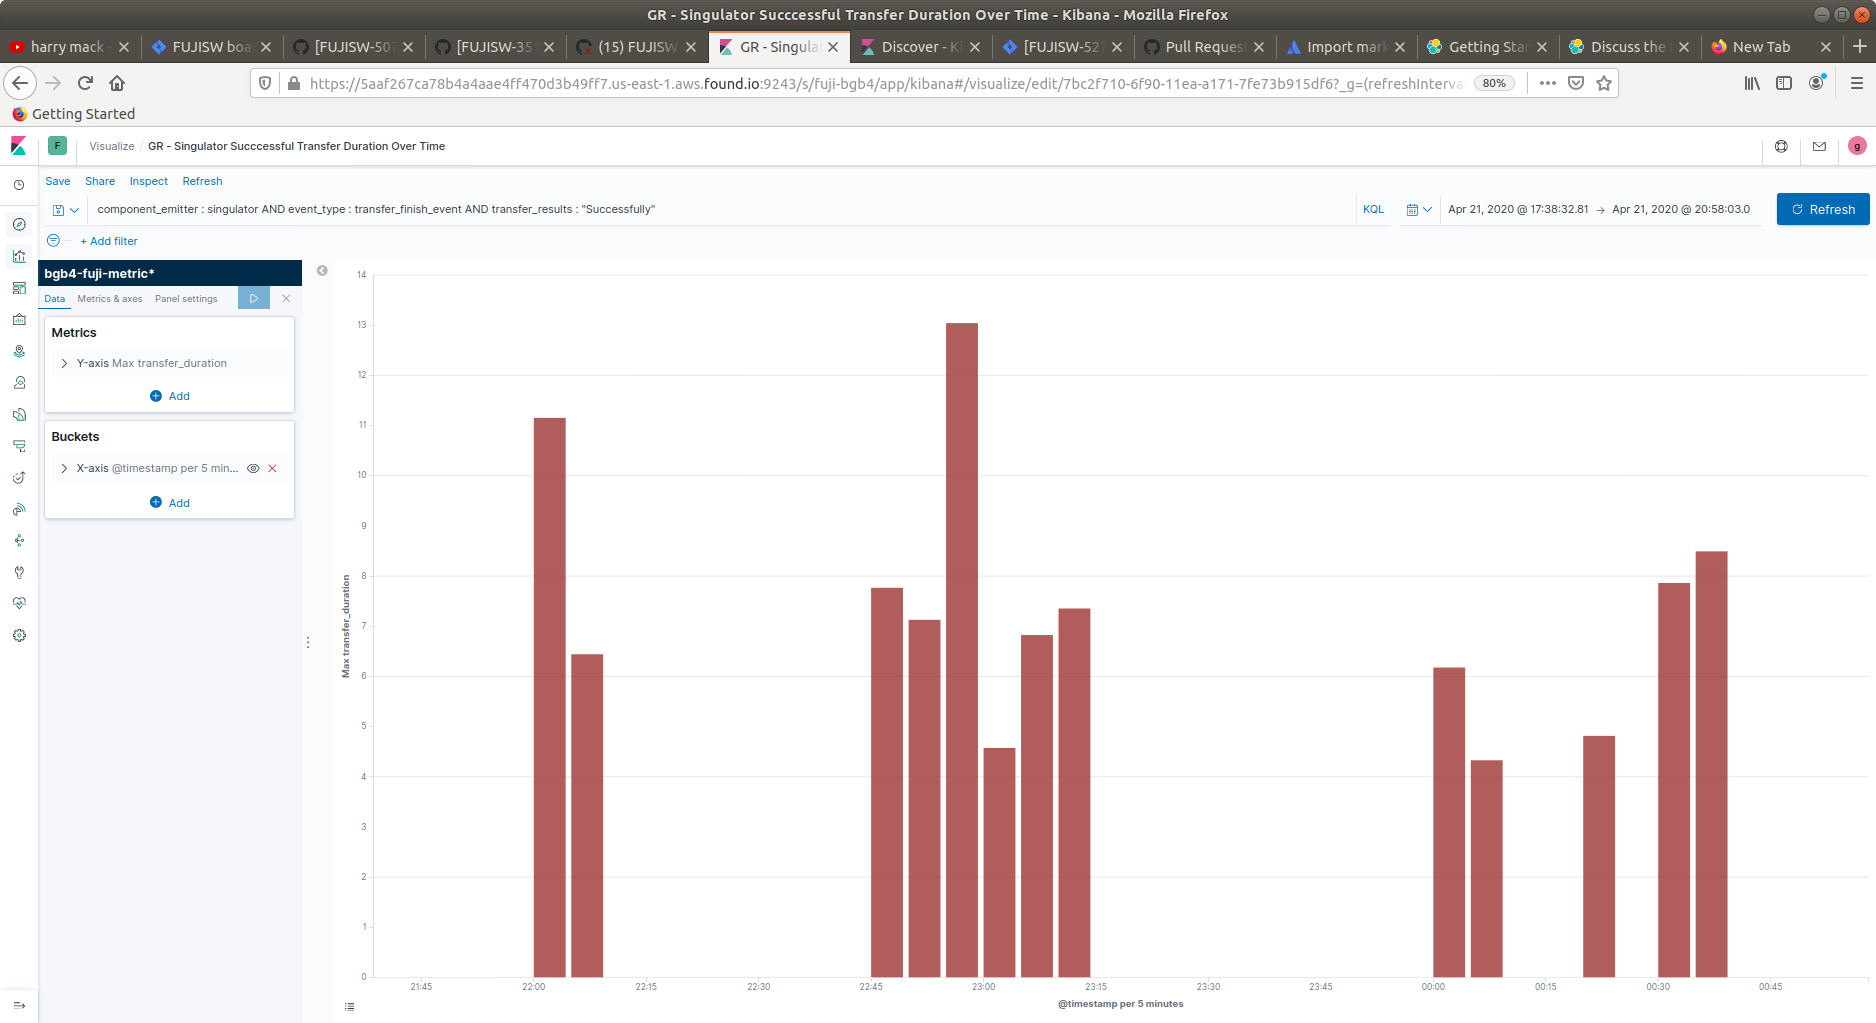
The query is exactly the same, the time range is exactly the same. @timestamp per 5 minutes is the same for both results. But, curiously, the x-axis for the graph has been shifted. In fact the x-axis does not display the specified time range. And yet, the depicted looks the same. There's about 4 cluster of bars for the elastic search results, and for the graph.
The question is, why is the time not being displayed on the graph? Why is it out of bounds with the specified time range? How do I correct it.
Note, it doesn't seem to matter what aggregate function I use or how big the time bucket is used, the X-axis displayed for the date histogram never displays the specified date range. I also playing around with time bucket truncation hasn't worked, either.
I changed the graph to use count, just to verify the relative heights of the bars look the same and it does check out. Notice that the x-axis is still shifted and out of range of query specification.

Anyways, any help, insights, or things to try out would be greatly appreciated. Thanks.