Este artículo está disponible en Español.

Analyzing traces in Discover faster and clearer
Having trouble with slow endpoints and not sure where to start?
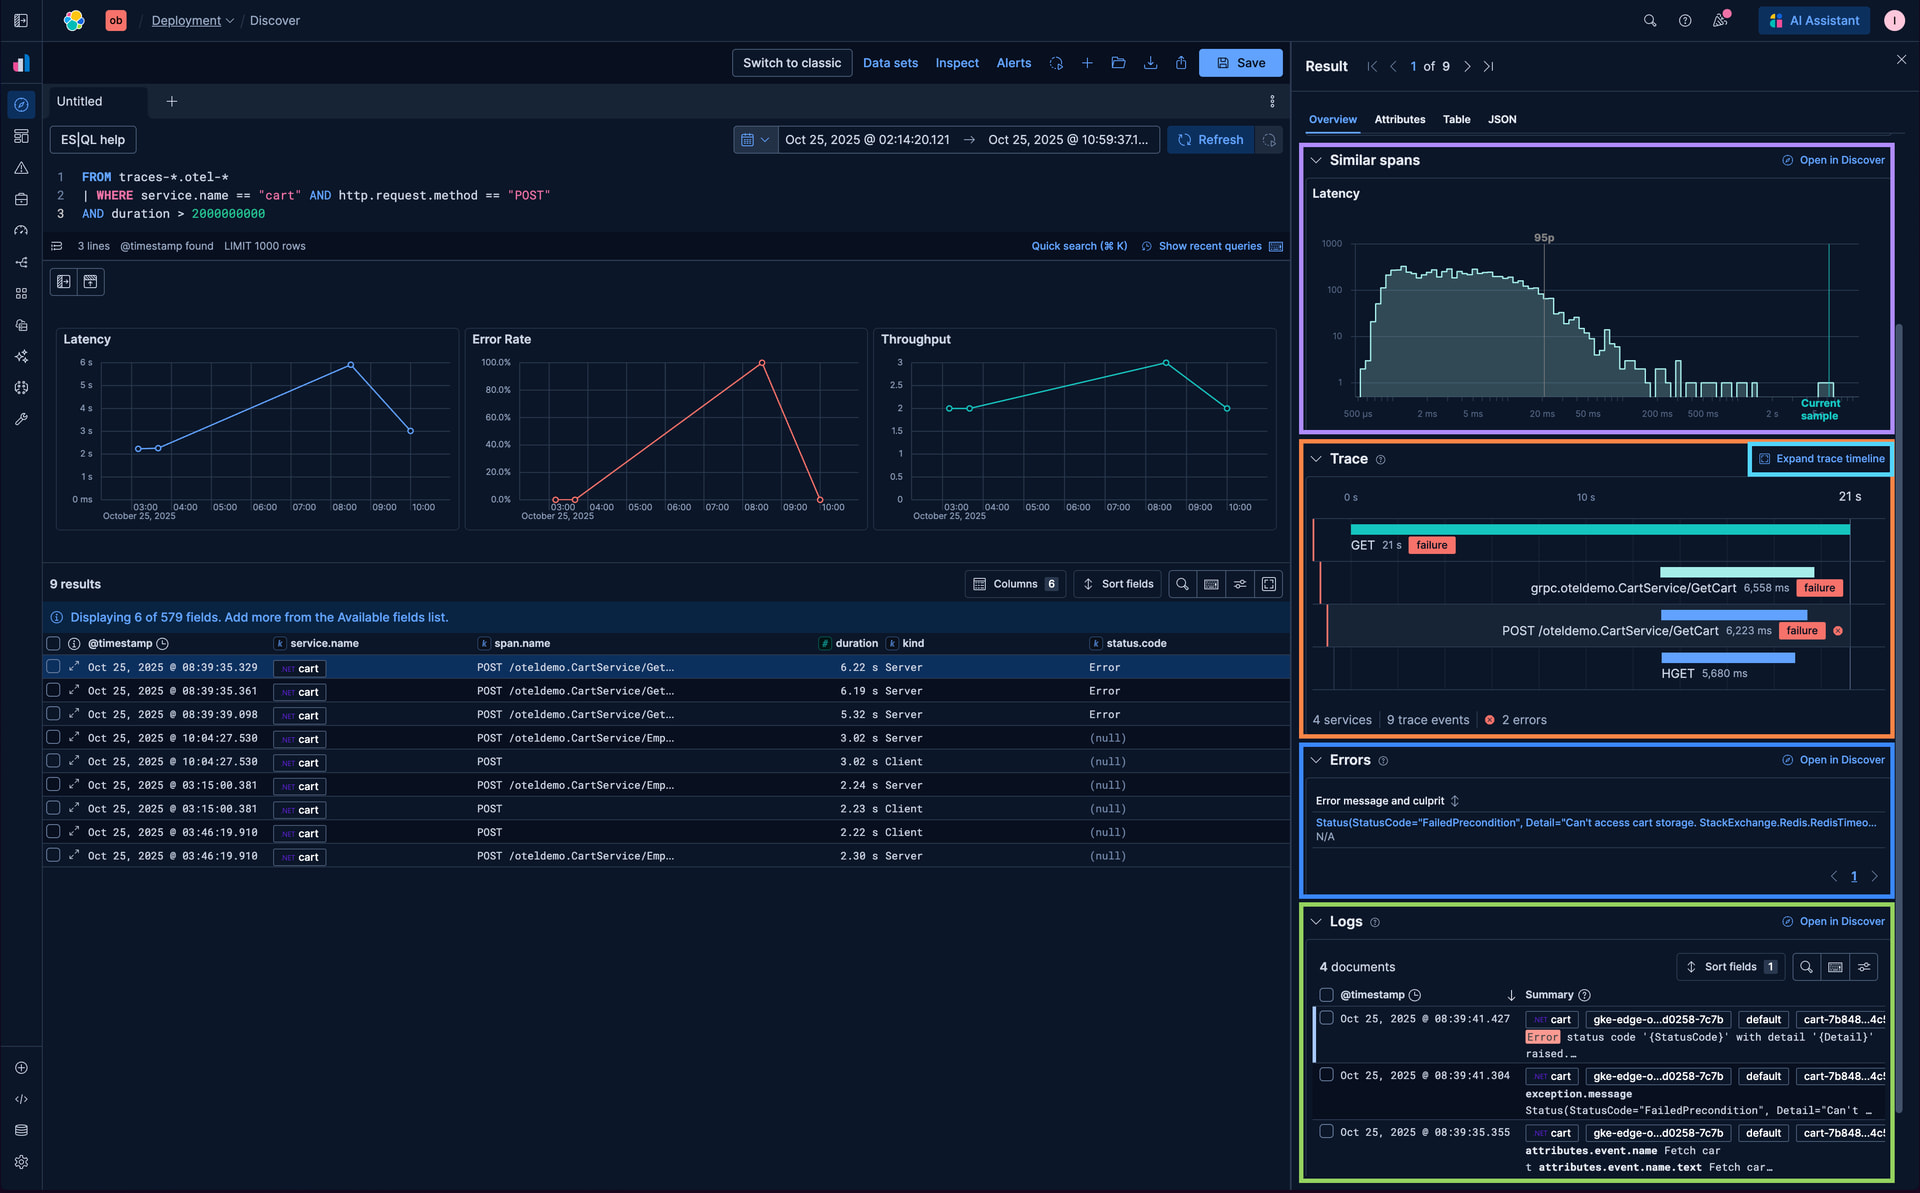
Now in Discover, when the Solution View of the space is set to Observability, you can see trace timelines, associated errors, related logs, and metric visualizations for similar spans, all in one place.
This gives you full context of the trace without switching interfaces, making problem investigation much faster.
Investigating latency patterns
Start by looking for slow POST transactions
Filter by duration to see only the slowest requests:
FROM traces-*.otel-*
| WHERE service.name == "cart" AND http.request.method == "POST"
AND duration > 2000000000
Examine individual spans
Open the slow spans to check attributes such as status.code or span.name to see which operations contribute most to latency.

Narrow down the search
When something catches your attention, adjust your filters or query to focus on specific spans, services, or time ranges:

Start analyzing
Now that the new results are in, here’s what you can explore right within the flyout:
- Analyze latency patterns
- Check the timeline preview
- Explore the complete timeline
- Review associated errors
- Dive into related logs
Everything you need for the analysis is accessible without leaving the flyout, keeping your context intact.
Analyze latency patterns
Use the latency distribution curve to understand whether this span is faster or slower compared to other similar spans. You can also click to open all similar spans in Discover for a deeper analysis.

Check the timeline preview
The timeline overview helps you quickly spot any errors in the trace. This gives an immediate sense of issues without opening the full trace.

Explore the complete timeline
Opening the timeline provides full visibility into the trace, allowing you to examine all related spans and errors. This makes it easier to identify which parts of the operation are contributing to performance issues.

Review associated errors
Look at the related errors to pinpoint specific failures affecting the trace. You can also click to open these errors in Discover, which helps you understand what went wrong and highlights problematic areas.

Dive into related logs
Related logs give additional context around the trace. You can open these logs in Discover as well, making it easier to connect spans, errors, and logs to understand the observed behavior.

With these improvements, investigating traces and performance issues in Discover has never been faster or clearer. You can get full context on your spans, errors, logs, and latency patterns all in one place.
We’re continuing to enhance this experience by adding more contextual information for even better analysis, check out our blog post "A new era for Elastic Discover: ES|QL, context & multi-tabs" to see all the latest Discover improvements and stay tuned for future updates!