Hi,
I need a help. I am new to Machine Learning. My CPU usage in data forecasting showing date and time in X-axis and number of core( system.cpu.total.pct)in Y-axis . Can i able to get Y-axis in percentage?
Whether 1 week of CPU_Utilization data is much enough for data prediction in machine learning or it need more than that.
Can you supply a screenshot for what you're seeing? I am having trouble understanding your question.
By the way - a week's worth of Metricbeat data should be fine.
Thanks. I need to monitor CPU utilization in my server. my average cpu utilization is 6 to 12% my cpu core is 2.
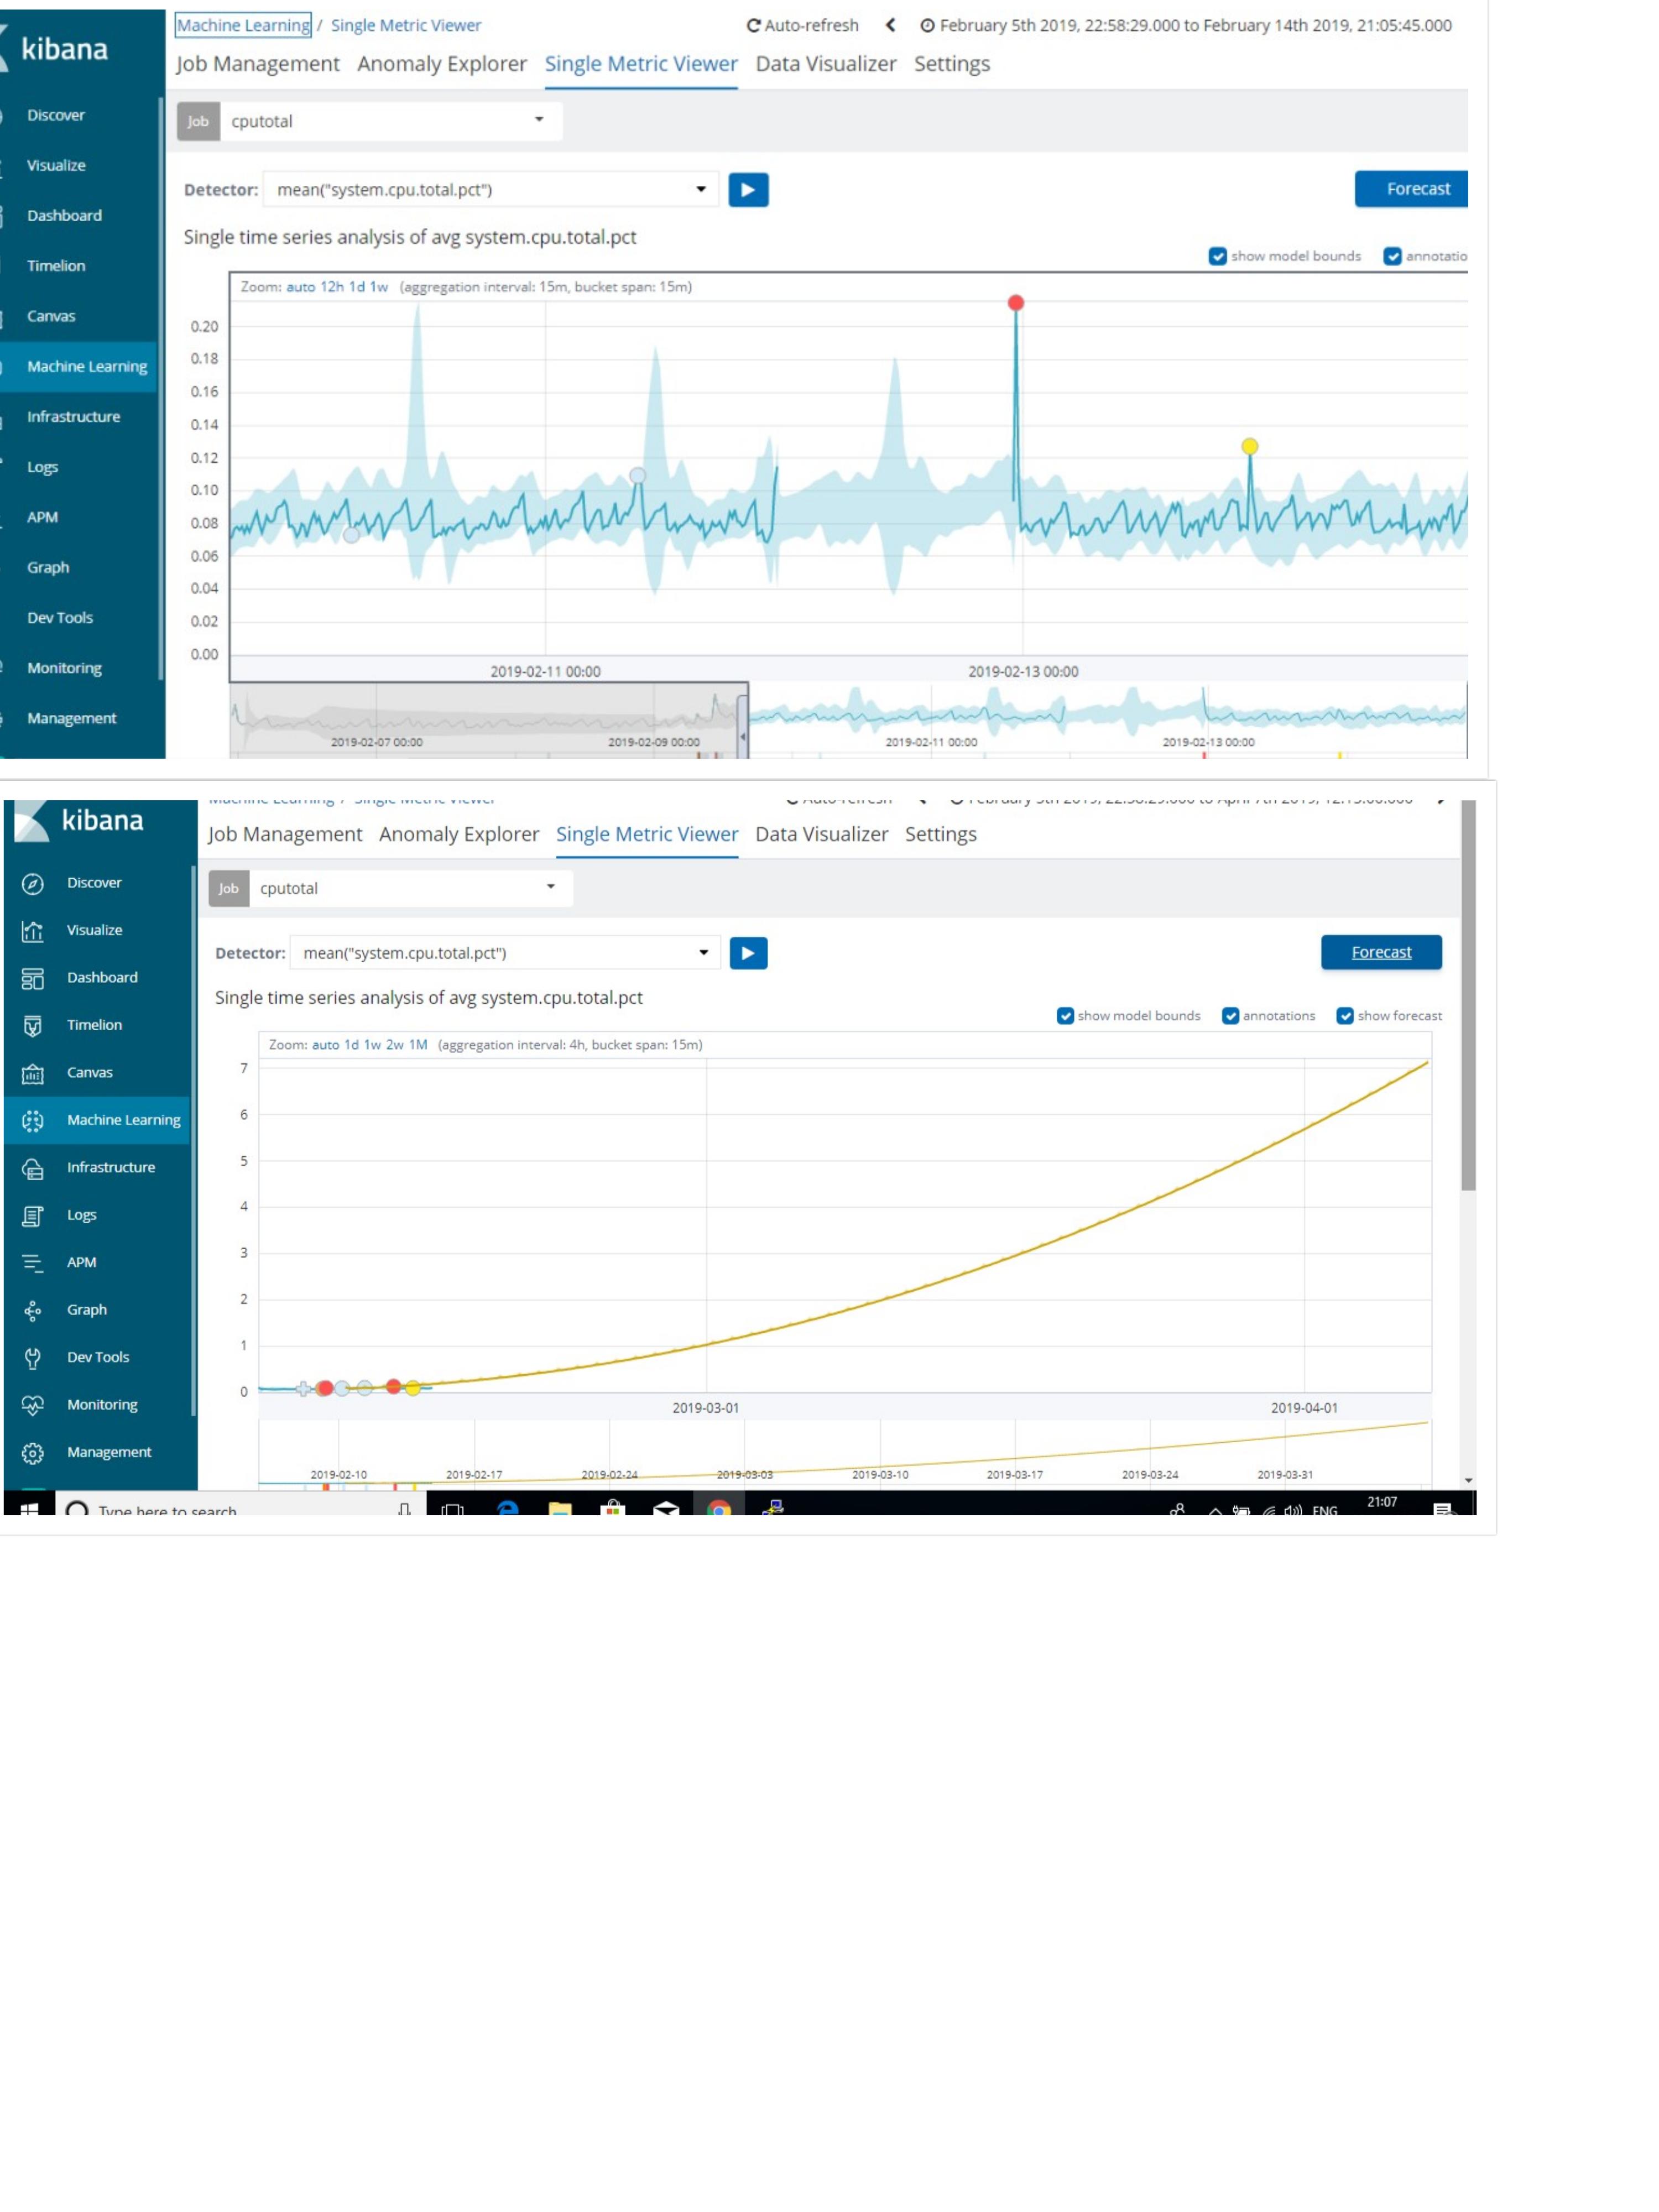
Attached my kibana screenshot before and after forecast of system.cpu.total.pct in ml for 2 months.
How can i get this in % . what's it mean in Y axis i don't understand. Is it CPU core. If its number of CPU core how it can goes upto 7 within 2 months.
It is in % already. The problem is that you are trying to forecast 8weeks out for something that has been observed for only 1week. You should limit your forecasts to at most the amount of time that you have data for.
Remember, that the forecasts are a probabilistic extrapolation of the observed data. If, for example, the data exhibits a slight upward trend, then that behavior will be carried forward.
Bottom line - only forecast out as much as the amount of data seen by the ML job. However, if you have more than 8weeks of data observed by the ML job, the forecast is still limited to be a maximum of 8 weeks.