Hi all,
I'm trying to visualize my systems' current CPU usage which I receive through metricbeat. The field I'm interested in is system.cpu.system.norm.pct. As I can see in the discovery tab, the data is shipped correctly:

However, if I try to visualize the most recent value using a Gauge, I always get 0 as the value:
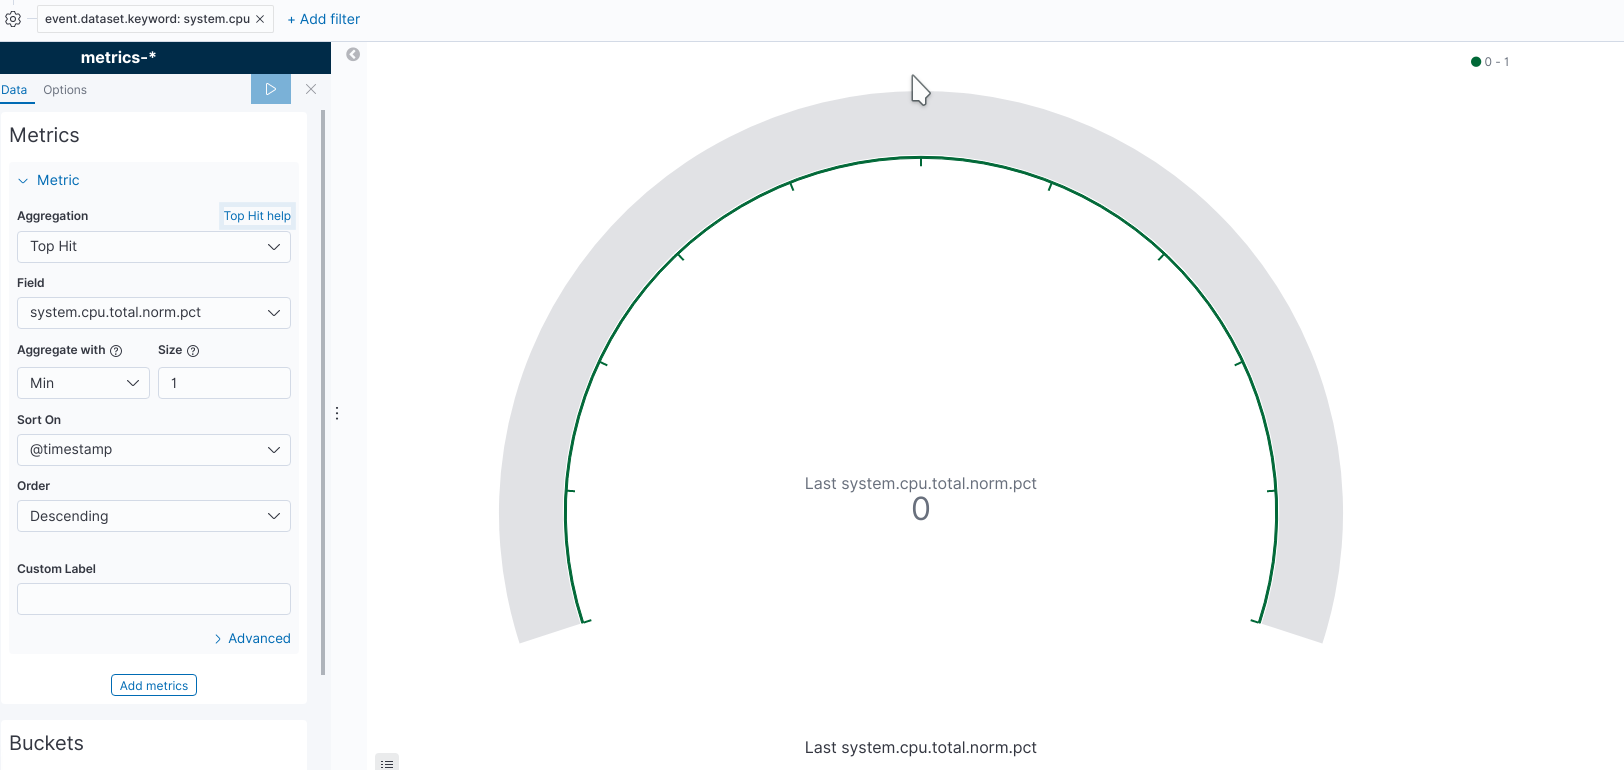
I get the same result with other aggregation types. The time range is exactly the same in the visualization as in the discovery.
I'm running metricbeat, elasticsearch, and kibana on version 7.1.0.
Thanks in advance.
