Kibana version 6.7
We are trying to create a dashboard with a horizontal bar based on a field named duration of type number. We want to add a static line to show the Threshold of sorts for the entire series.
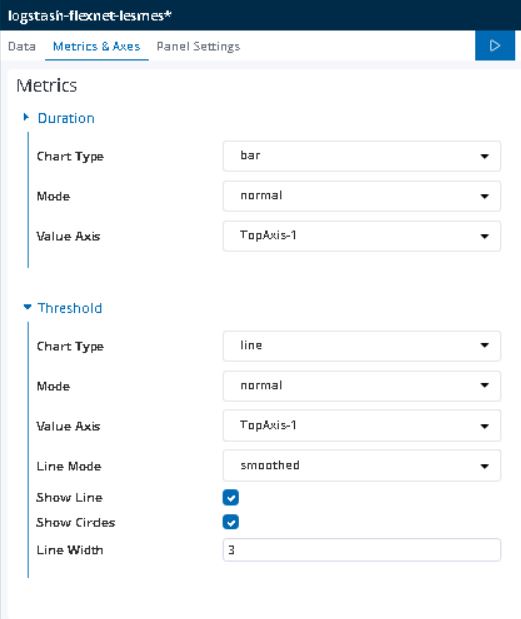
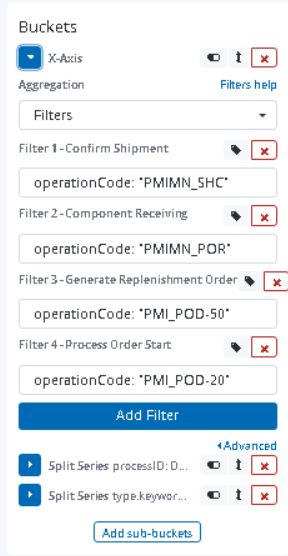
We followed this blog and this blog and created a scripted field with a value 10 and used it in my Y axis aggregation. Adding screenshots of my visualization settings.
We end up with a dot as our Threshold line in our graph instead of a line (as attached).
How do I draw a line across the entire series as marked in the screenshot?


Please let me know if any other details are needed.
Thanks
Pavan
