Hi, We have a mechanism which handles a queue of database operations (INSERT, DELETE and UPDATE operations) for various tables, I am now working on creating a Kibana dashboard with some metrics about this queue, but am hitting a wall.
I've currently got an application which gets the queue size every 10 minutes and indexes this to elastic search as this type of document:
I would like to start with the simplest dashboard item, which would be a total counter of all pending operations, for all tables, so with the above example, that would be 8.
From what I read, I think I would have to use a scripted metric, however I don't see a way in the docs to calculate all subfields by wildcard, is there any way to accomplish this?
Later on, I would also like a total metic for all operations per table. And finally, create a graph showing these numbers over time, based on the timeStamp field.
I would also be open to structuring this data in another way, it that would help with aggregating it.
Thanks for both your suggestions, I went with @dadoonet's suggestion, which does work fine for creating some charts and counters.
However, If I aggregate using sum, and enlarge my timespan (I'm indexing all pending operations, for all tables, every 10 minutes) to e.g. 24h, the aggregate function will start summing up different 'snapshots' , causing the numbers to appear twice as large.
Is there way to tell Kibana to only group by specific timestamp, or I could e.g. add a guid to each record, which would be the same for all records belonging to 1 snapshot, and then group by that guid.
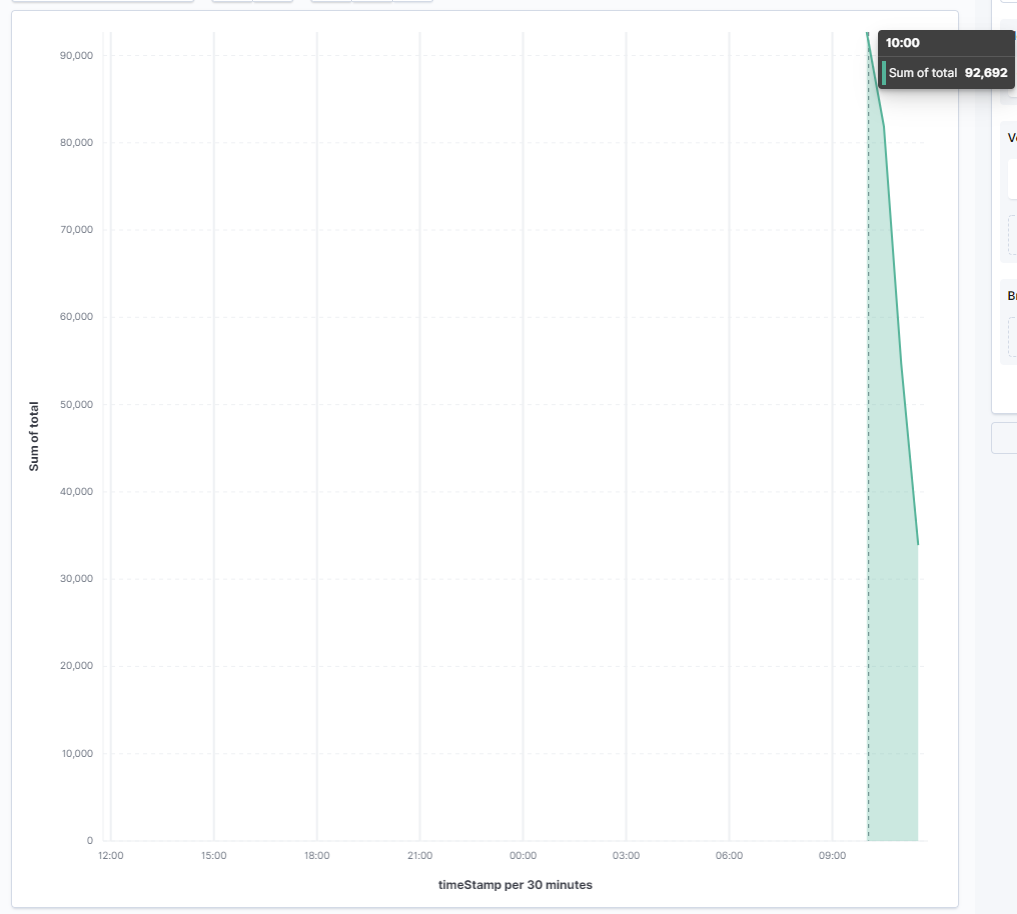
So I'm trying to get a graph over time in kibana, using the lens visualisation. This works, but when I set the time period too big (e.g. 24h), the graphs groups together the values per hour or so, causing totals of 2 'snapshots' to be summed up together, making the graph appear as if there were double the amount of operations pending.
This is the data shown over the last 2 hours, which is fine (although I'd like to get rid of the 0 values in between):
Apache, Apache Lucene, Apache Hadoop, Hadoop, HDFS and the yellow elephant
logo are trademarks of the
Apache Software Foundation
in the United States and/or other countries.