Hello. I am new in Kibana.
The problem is that I installed an ELK stack on the Ubuntu 20.04 server.
I have no problem getting any logs from all of my other servers regardless of the operating system they are using.
However, I am have problems with the filebeat modules and dashboards that came with it.
For example [Filebeat System] Syslog dashboard ECS everything works fine with Ubuntu servers, but with Amazon Linux 2 servers I get correct data only from the syslog board. Sudo commands and SSH logins do not return anything.
It's the same with Redis and mongodb dashboards.
Somehow I managed to get the nginx dashboard to work.
My setup looks like this:
Master server monitoring with ELK and filebeat installed.
The monitoring target are on other servers under the direction of the amazon linux 1 2, and ubuntu 16 18 20. they have filebeat 7.10 installed on them, which transmits data to the logstash to the main server.
On master server i have 2 config files to logstash input/output.
    /etc/logstash/conf.d/02-beats-input.conf
    input {
      beats {
        port => 5044
      }
    }
and
    /etc/logstash/conf.d/30-elasticsearch-output.conf
    output {
      if [@metadata][pipeline] {
        elasticsearch {
        hosts => ["localhost:9200"]
        manage_template => false
        index => "%{[@metadata][beat]}-%{[@metadata][version]}-%{+YYYY.MM.dd}"
        pipeline => "%{[@metadata][pipeline]}"
        }
      } else {
        elasticsearch {
        hosts => ["localhost:9200"]
        manage_template => false
        index => "%{[@metadata][beat]}-%{[@metadata][version]}-%{+YYYY.MM.dd}"
        }
      }
    }
Please tell me what other useful information I can send you. Or correct if I'm doing something wrong.
Thank you. Regards.
@Sergey_Kuyanov Welcome to the community!
I don't see any obvious issues with your setup, especially since nginx seems to work on your Linux servers.
Have you enabled the redis and mongod modules? i.e. are these enabled in your filebeat.yml file?
There's an example on what these settings should be in the filebeat-reference-yml given in the documentation. Note that the link to the docs is for v7.10. I'm not sure what version of the stack you are running.
You might also want to check that all your paths to your logs are correct. There a reference to where those are for different os here.
You might also need to check permissions, they can be a little tricky with different os.
Dear @cheiligers.
Thank you very much for your attention.
I am confused by the fact that I managed to get nginx to work, but not the rest of the dashboards.
I will try to provide you with as complete information as possible.
I am enabling modules via command line.
[ec2-user @ imchangethis ~] $ sudo filebeat modules list
Enabled:
mongodb
nginx
redis
system
Part of my filebeat.iml:
- type: log

  # Change to true to enable this input configuration.
  enabled: true
  paths:
    - /home/cb_chat/Chat/logs/console.log
    - /var/log/nginx/*.log
    - / var / log / secure
    - / var / log / messages
    - /var/log/mongodb/*.log
  #exclude_lines: ["^ \\ s + [\\ -` ('. | _] "]
  exclude_files: ['\ .gz $']
My mongodb config:
[ec2-user @ imchangethis ~] $ sudo cat /etc/filebeat/modules.d/mongodb.yml
# Module: mongodb
# Docs: https://www.elastic.co/guide/en/beats/filebeat/7.10/filebeat-module-mongodb.html

- module: mongodb
  # All logs
  log:
    enabled: true
    var.paths: ["/var/log/mongodb/*.log*"]
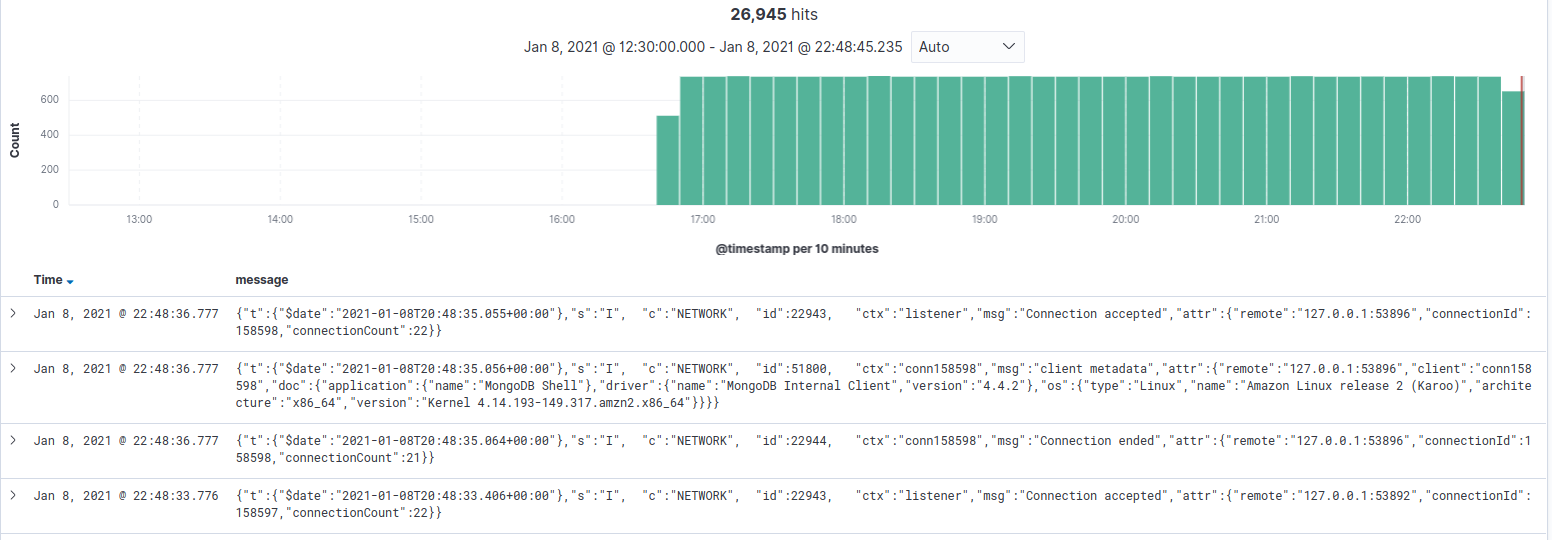
I get and see all these logs in Discovery.
What's interesting is that the mongo dashboard started showing nginx errors:
It is the same with
redis and
SSH access.
This is a very fresh install and I stuck with the same 7.10 version everywhere.
Redis config:
[ec2-user@imchangethis ~]$ sudo cat /etc/filebeat/modules.d/redis.yml
# Module: redis
# Docs: https://www.elastic.co/guide/en/beats/filebeat/7.10/filebeat-module-redis.html

- module: redis
  # Main logs
  log:
    enabled: true
    var.paths: ["/var/log/redis/*.log"]

  # Slow logs, retrieved via the Redis API (SLOWLOG)
  slowlog:
    enabled: true
    var.hosts: ["localhost:6379"]
System:
[ec2-user@imchangethis ~]$ sudo cat /etc/filebeat/modules.d/system.yml
- module: system
  # Syslog
  syslog:
    enabled: true
    var.paths: ["/var/log/messages*"]


  # Authorization logs
  auth:
    enabled: true
    var.paths: ["/var/log/secure*"]
I really see them all, but only in discovery:
Thank you. Regards.
@Sergey_Kuyanov The error messages you're seeing in the mongodb dashboard suggests there's something wrong with the SSL settings. As this Discuss post suggests, you should double check those in your mongodb.yml file. What's puzzling me is the fact that you can see logs in Discover though and not in the dashboard. I think we should call on the Beats team for guidance here.
@Marius_Dragomir Do you have an idea of what might be causing the problem here?
Not much I can really tell from this, since I think the logs that you see in Discover might be just read from file with the Log processor instead of the mongo or nginx modules. Can you remove the extra paths from filebeal.yml and just keep the ones in the enabled modules?
If the log processor is the first that reads the data (and I assume that it is), they won't be converted to ECS and you'll only see them as standard docs with a timestamp and a message.
Hello @cheiligers and @Marius_Dragomir
I hope you are doing well.
I've been doing this again all day today.
And here's what I found:
- What made the nginx dashboard work is the entry to the nginx log in the filebeat.yml file.
This part:
    - type: log

      # Change to true to enable this input configuration.
      enabled: true
      paths:
        - /home/cb_chat/Chat/logs/console.log
        - /var/log/nginx/*.log
        - / var / log / secure
        - / var / log / messages
        - /var/log/mongodb/*.log
      #exclude_lines: ["^ \\ s + [\\ -` ('. | _] "]
      exclude_files: ['\ .gz $']
As soon as we remove them, the dashboard becomes not working. And I don't understand why they even go there.
2. I wrote the modules into the filebeat.yml file and this also did not make them work.
3. I turned off the log type in the filebeat.yml file and after that nothing came from the server.
From this I think we can conclude that the modules are not working at all in my case. But they work fine on ubuntu servers.
I also created a new server based on RHEL 8. Set it up and configure by documentation. And Behavior is the same. Master sees all his modules and they work. But slaves only work for Ubuntu. I hope I didn't miss anything since it's already late at night.
I want it to work like this:
And since it works for
ubuntu I don’t understand why it doesn’t work for
amazon linux 2. Can I try other bits?
I've deleted and recreated everything already, many times. No effect.
Thank you. Regards.