Auditbeat system overview ECS

Hi there,

Running elasticsearch and kibana as a docker with version 7.12.1 and auditbeat on two hosts with also version 7.12.1
Everything is running fine.

I just have found an issue in the Auditbeat System Overview Dashboard. The "Login Count" Metric is showing a wrong value.

It shows 450. But when you open the visualization then you get the right value:

In the visualization you can see a filter at the top.
It looks like it is not used in the dashboard.

When I change the filter to a query and press "save & return", it works:

Sorry for the big pictures, but I think it shows better what I want to show.

Best regards
Malte

Hi @logger Hmmm yes weird, I am seeing the same thing with a fresh 7.12.1 deployment

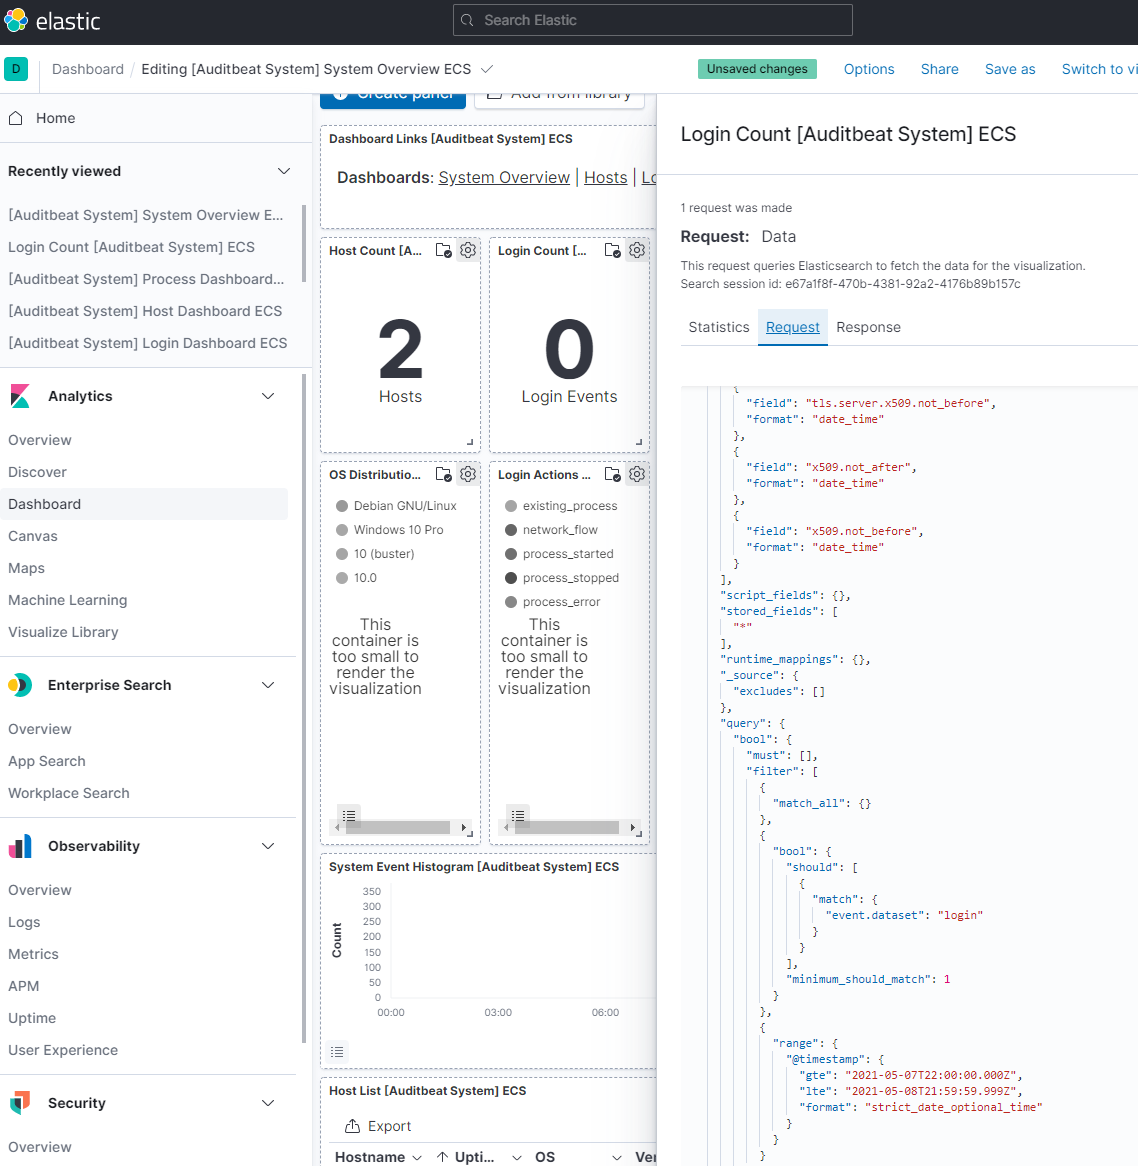
One thing I noticed is all the disabled filters... I am not sure they are supposed to be there (They are in my newly built cluster) if you click that little pull down on the left and remove all. I think the dashboard will work as designed. I think perhaps there is a bug or some test code / settings made it into the dashboard.

It appears the disabled filters are overriding the filter for each panel.

Then at first glance it looks correct, then when I inspect the data I see the correct query.

If this works you may need to edit / save the dashboard to persist this..

Let me know what you see.

If you validate perhaps you could open an issue here:

Hi,

by removing the disabled "login" filter everything works as expected.

It changes the filter in the request to the one from the vizualization:

I have not checked the other filters. But I think maybe the Dashbaord should come without predefined disabled filters.

This topic was automatically closed 28 days after the last reply. New replies are no longer allowed.