In the Discovery Mode, I know that we can create a query (e.g. type: http) to filter out data before building visualizations. However, I do not want to do that. I need the unfiltered data.
I want to create a Data Table in Visualize Mode with its 2nd column to display count where Attempt = "Failed". No. of Failed Attempts is subset of Total No. of Attempts. Can we filter data at the chart-level by column in Visual mode?
Session #
Attempt
1
Failed
1
Failed
1
Passed
2
Failed
2
Passed
...
...
Total No. of Attempts: count of Attempt No. of Failed Attempts: count of Attempt where Attempt is "Failed"
If Total No. of Attempts and No. of Failed Attempts could be rows instead of columns, you could use Filter aggregation to show the data you want, like demonstrated here: Data table visualization with custom aggregation query.
Thank you for sharing the reference. You did answered my question on whether we can filter data at the chart-level. However, I need them to be columns instead of rows, because transaction records will be populated in rows.
Do you think scripted fields will help in my requirement?
I don't think this is supported currently, but can be tracked here. Also there is a chance that a 3rd-party kibana-enhanced-table plugin can do what you want.
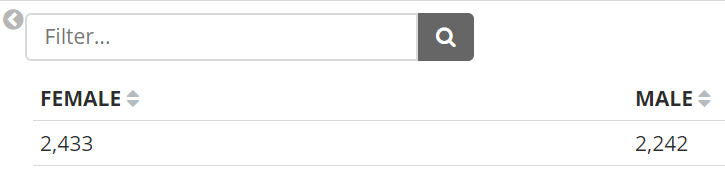
The 3rd party kibana-enhanced-table plugin looks amazing. I have yet to install it on my server but I think it can do exactly what I wanted. Thanks. Anyway, I have tried the native Split Table by Columns option, but it looks really weird.
Apache, Apache Lucene, Apache Hadoop, Hadoop, HDFS and the yellow elephant
logo are trademarks of the
Apache Software Foundation
in the United States and/or other countries.