Cannot configure grok pipeline to processors in the elastic agent

Hi everyone!

I completed and successful configure grok debuger log format of haproxy.

And next I was added code grok pattens to pipeline

Finally step I have added pipeline to processors in the elastic agent but seem it is wrong.

I was tried configure again but is is wrong. Everyone help me to solve this problem, thank you very much

Hi @vanhaiit90

Exactly which integration did you use? The HAproxy?

I think You are adding the pipeline in the wrong place.... Only processors go there

See this tutorial

If you scroll to the bottom there is a custom pipeline...

Add Custom Pipeline

You need to add you grok to that pipeline.

1 Like

no I do not. I mean I finished configuring the pipeline and then I inserted the text pipeline: **

logs-haproxy.log@custom

** into the proccessors on elastic agent and it was wrong

Where you are adding the pipeline in the processor is incorrect...

Follow the tutorial.

When you add the custom pipeline where I showed it will automatically be called.

Hi Stephenb!

I have configured it exactly according to the steps you showed. However I seen it is seem it not true.

The custom pipelines for grok haproxy was configured

%{SYSLOGTIMESTAMP:timestamp} %{HOSTNAME:hostname} %{WORD:process}[%{NUMBER:pid}]: %{IP:client_ip}:%{NUMBER:client_port} [%{NOTSPACE:haproxy.request_date}] %{WORD:frontend} %{WORD:backend}/%{WORD:server} %{NUMBER:time_queue}/%{NUMBER:time_backend_connect}/%{NUMBER:time_duration}/%{NUMBER:time_active} %{NUMBER:requests} %{NUMBER:bytes_read} %{NUMBER:frontend_errors} - - --%{NOTSPACE:backend_queue} %{NOTSPACE:backend_connect}/%{NOTSPACE:server_queue}/%{NOTSPACE:server_response}/%{NOTSPACE:server_duration} %{NOTSPACE:session_status} "%{WORD:http_method} %{URIPATHPARAM:request_path} HTTP/%{NUMBER:http_version}"

Please help me check the grok patterns to see if they are correct

Hi @vanhaiit90

You will need to provide :

several sample log entries...

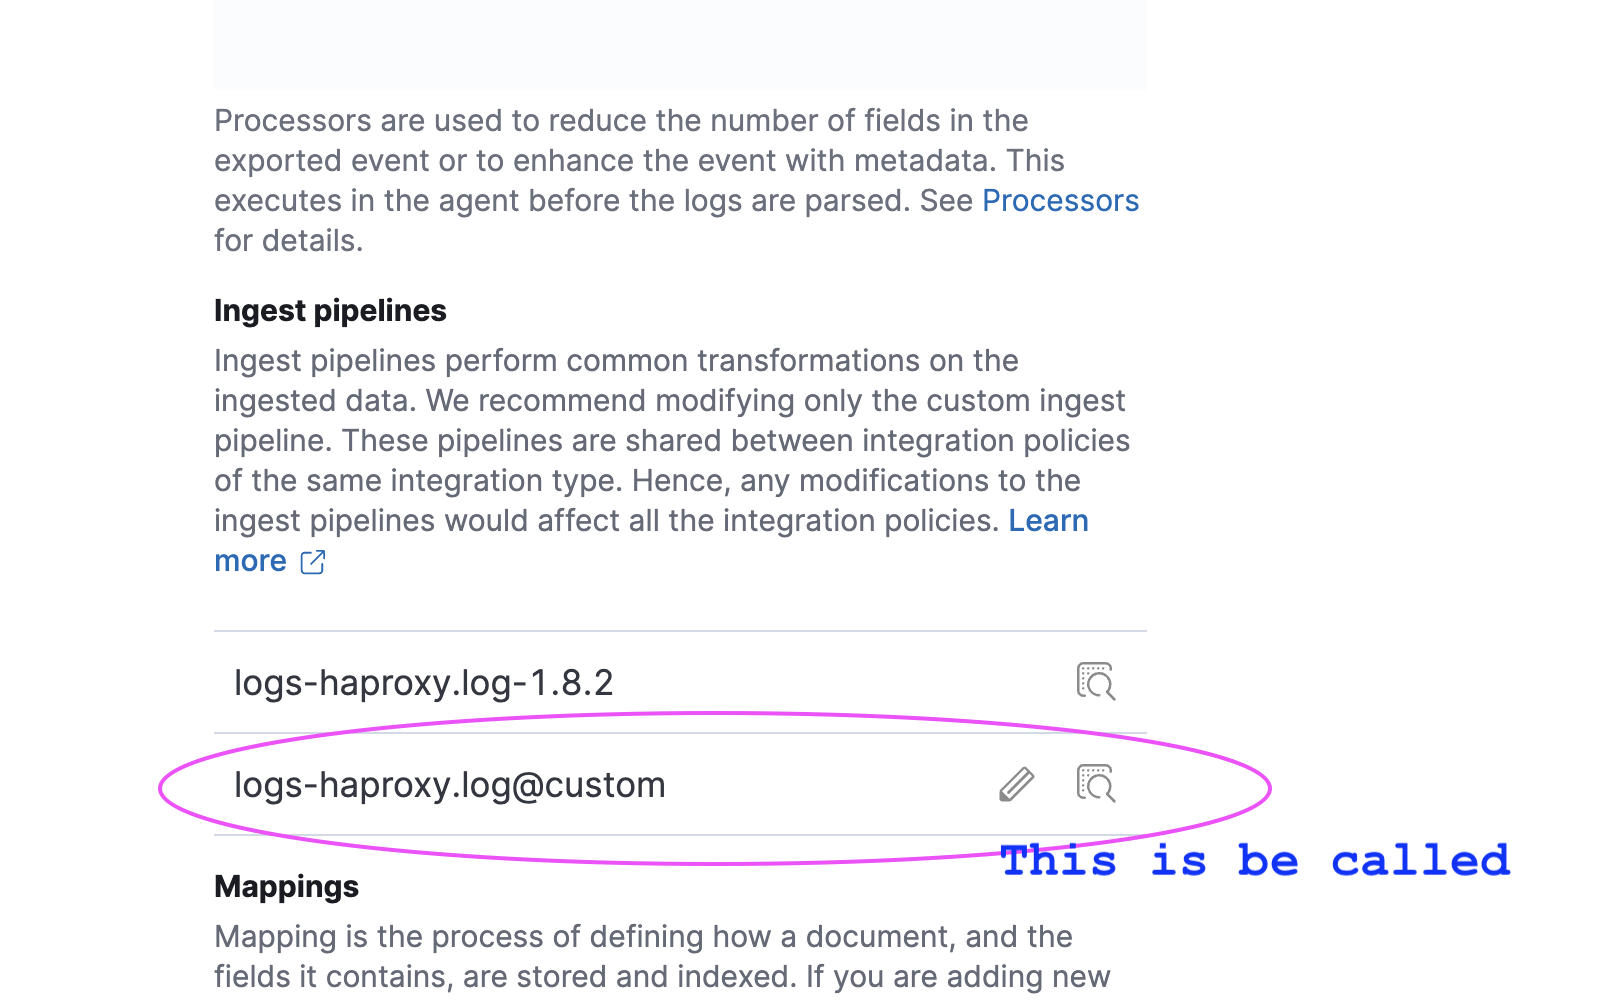
And the complete custom ingest pipeline not just the grok pattern.

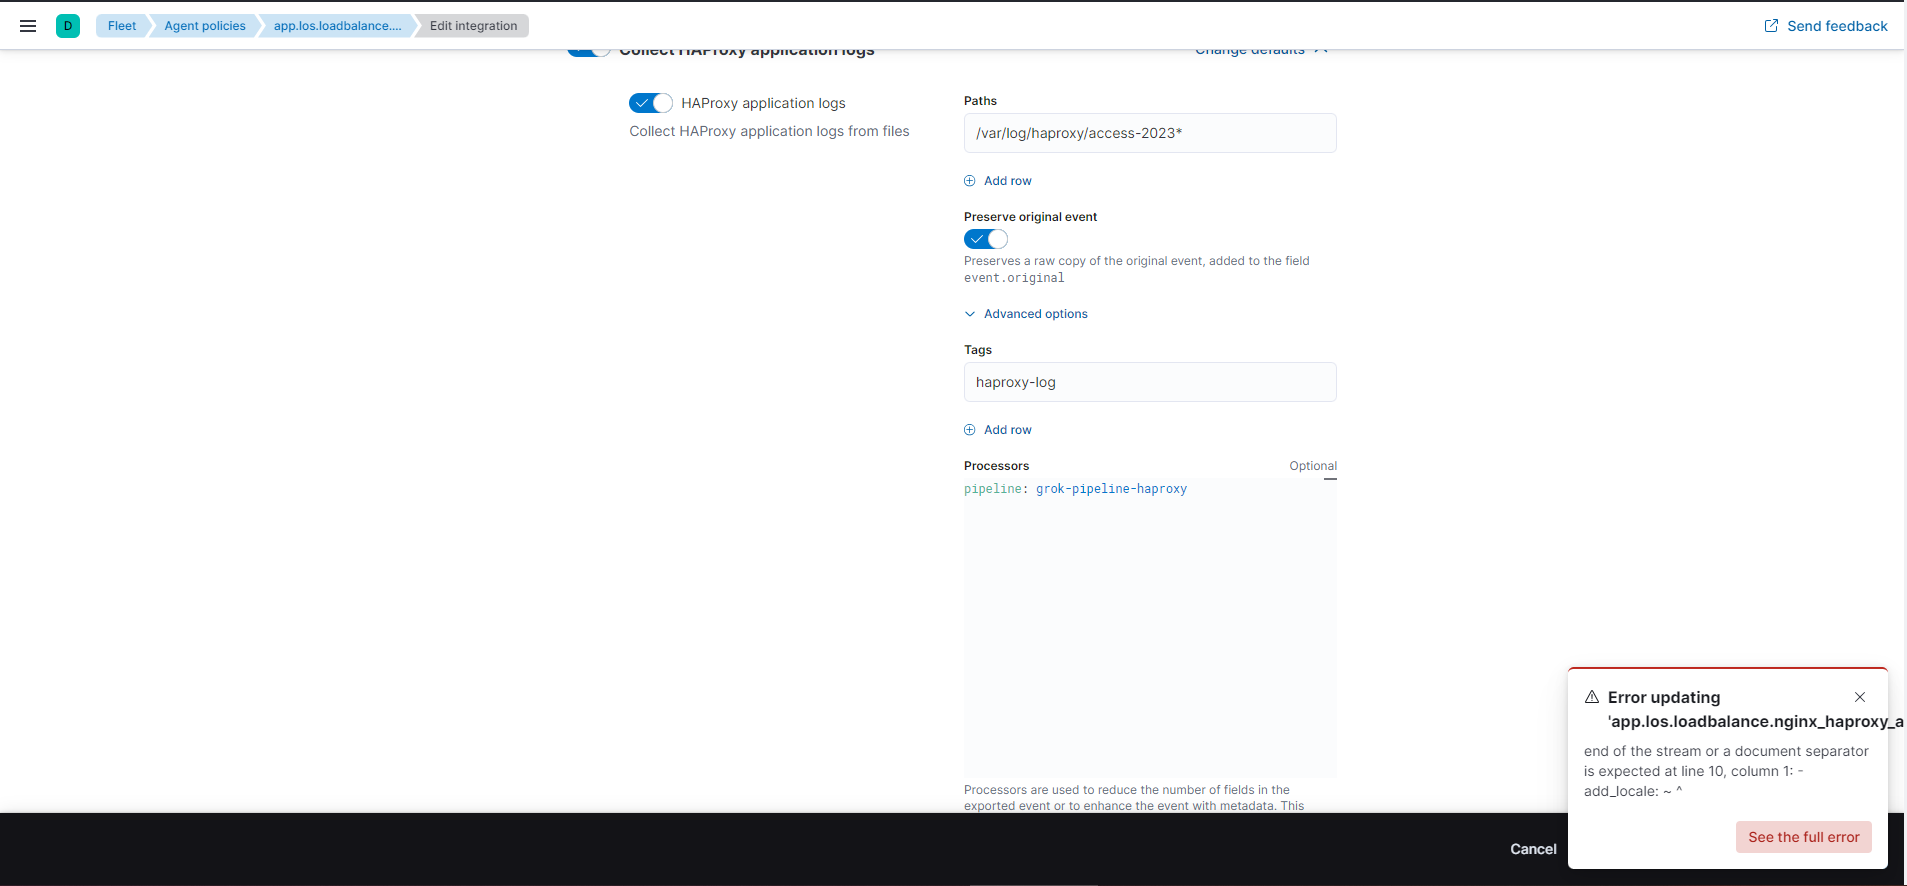
Also since you are using an Integration it will try to run the default pipeline first so are you sure that error message is not from the default pipeline which run first?

Did you see if the event.original is still available in the document?

Are you sure your pipeline is not working are the fields there?

You can add a simple set processor in your custom pipeline to make sure it is run...

Screenshots are very hard to debug... Actual text results are much better.

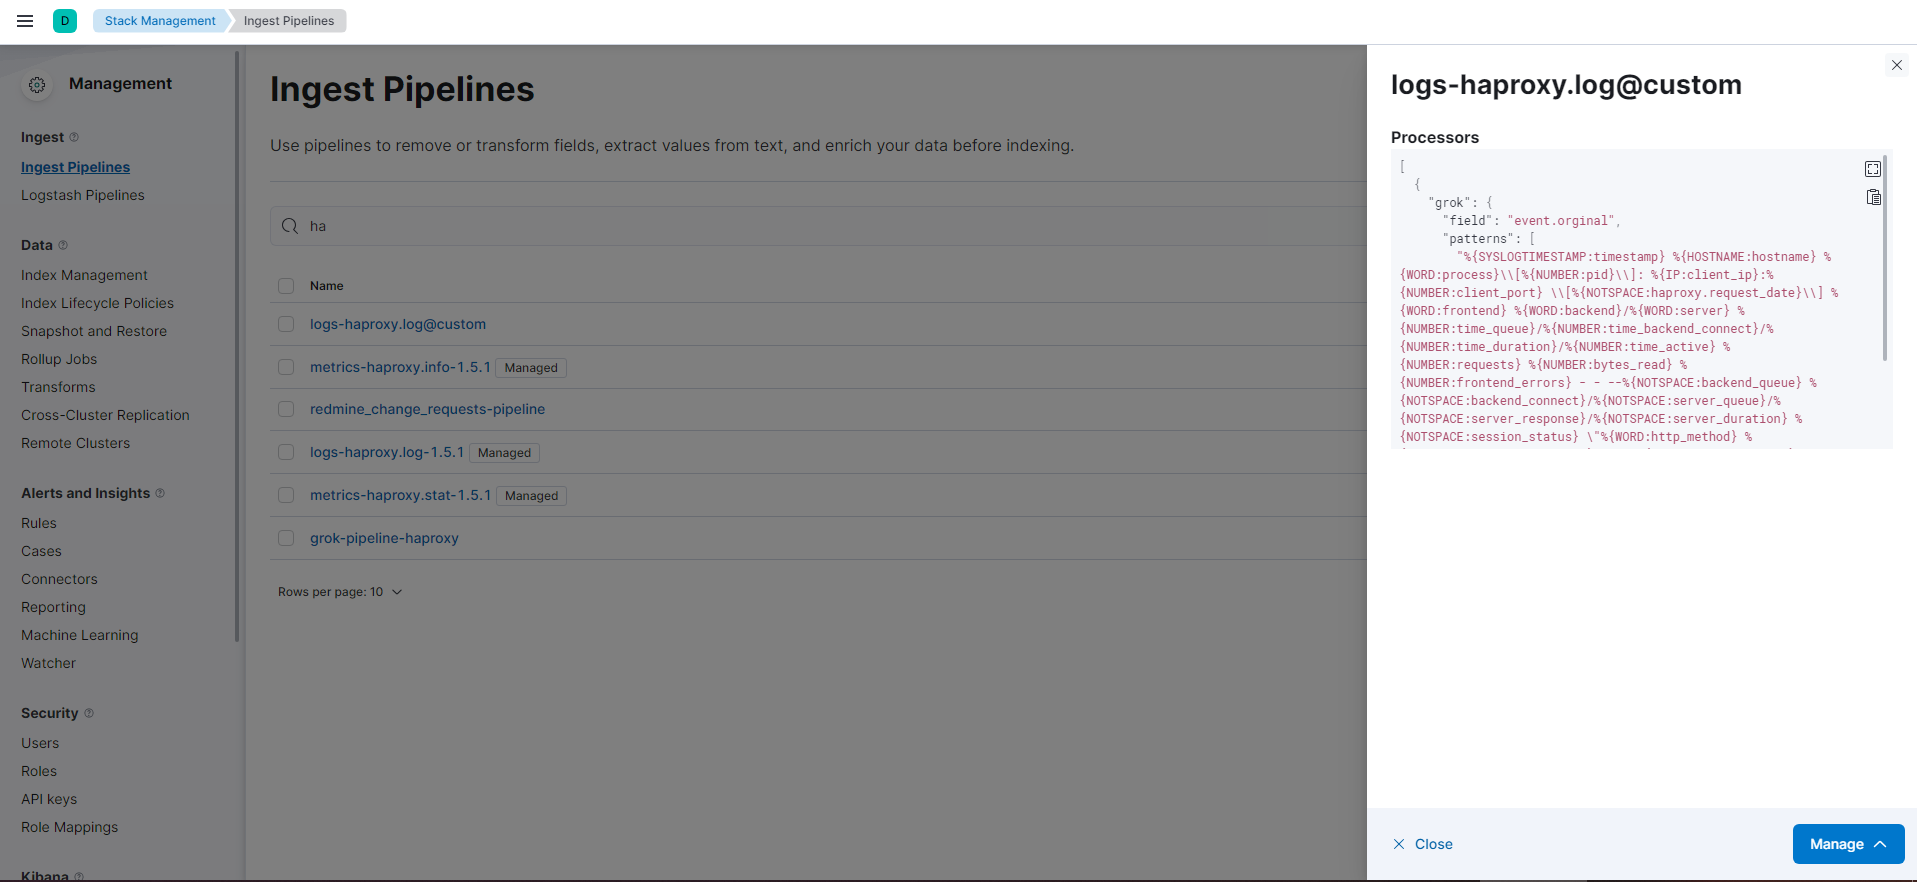
You can also go Kibana - Stack Management - Ingest Pipeline

Pick your custom pipeline... And edit it and then test with existing document with the pipeline tester.. you will need the index name and _id which you can get from Discover


1 Like

thank @stephenb very much I have resolved it

1 Like

Hi @vanhaiit90

What was the issue and resolution? it can help another user if you explain what the issue was and how you solved it ... as a good member of the community :slight_smile:

Because someone has configured it incorrectly according to the original config file of haproxy.cfg. And I was able to promptly backup and configure the haproxy.cfg file to match the fields corresponding to elasticsearch

1 Like

This topic was automatically closed 28 days after the last reply. New replies are no longer allowed.