Hi. I have elastic and kibana 7.8.0. I created few rollup jobs for get my old data more smaller and that jobs seems to b working in correct way. I can see this data on Discover page, but once I go to create any visualization it seems that there are no data in index. Was trying to find some documentation about this but there are very few information about how visualize rollup indexes. Can somebody help me with this?
One of my metricbeat index rollup jobs have this config:
    {
      "config": {
        "id": "rollup-metricbeat-processes-V2",
        "index_pattern": "metricbeat-*",
        "rollup_index": "summary-metricbeat-processes",
        "cron": "0 30 3 1/1 * ?",
        "groups": {
          "date_histogram": {
            "fixed_interval": "60m",
            "field": "@timestamp",
            "delay": "24h",
            "time_zone": "UTC"
          },
          "terms": {
            "fields": [
              "host.name",
              "process.name",
              "user.name"
            ]
          }
        },
        "metrics": [
          {
            "field": "system.process.cpu.total.pct",
            "metrics": [
              "avg",
              "max",
              "min",
              "value_count"
            ]
          },
          {
            "field": "system.process.memory.size",
            "metrics": [
              "avg",
              "max",
              "min",
              "value_count"
            ]
          }
        ],
        "timeout": "20s",
        "page_size": 1000
      },
      "status": {
        "job_state": "started",
        "current_position": {
          "@timestamp.date_histogram": 1598839200000,
          "host.name.terms": "some host name",
          "process.name.terms": "sqlservr.exe",
          "user.name.terms": "NT SERVICE\\MSSQLSERVER"
        },
        "upgraded_doc_id": true
      },
      "stats": {
        "pages_processed": 1880,
        "documents_processed": 910509698,
        "rollups_indexed": 1841278,
        "trigger_count": 24,
        "index_time_in_ms": 956837,
        "index_total": 1856,
        "index_failures": 0,
        "search_time_in_ms": 53702703,
        "search_total": 1880,
        "search_failures": 0,
        "processing_time_in_ms": 40147,
        "processing_total": 1880
      }
    }
This is how it looks like in Discover page

And this is how it looks like in a table visualization
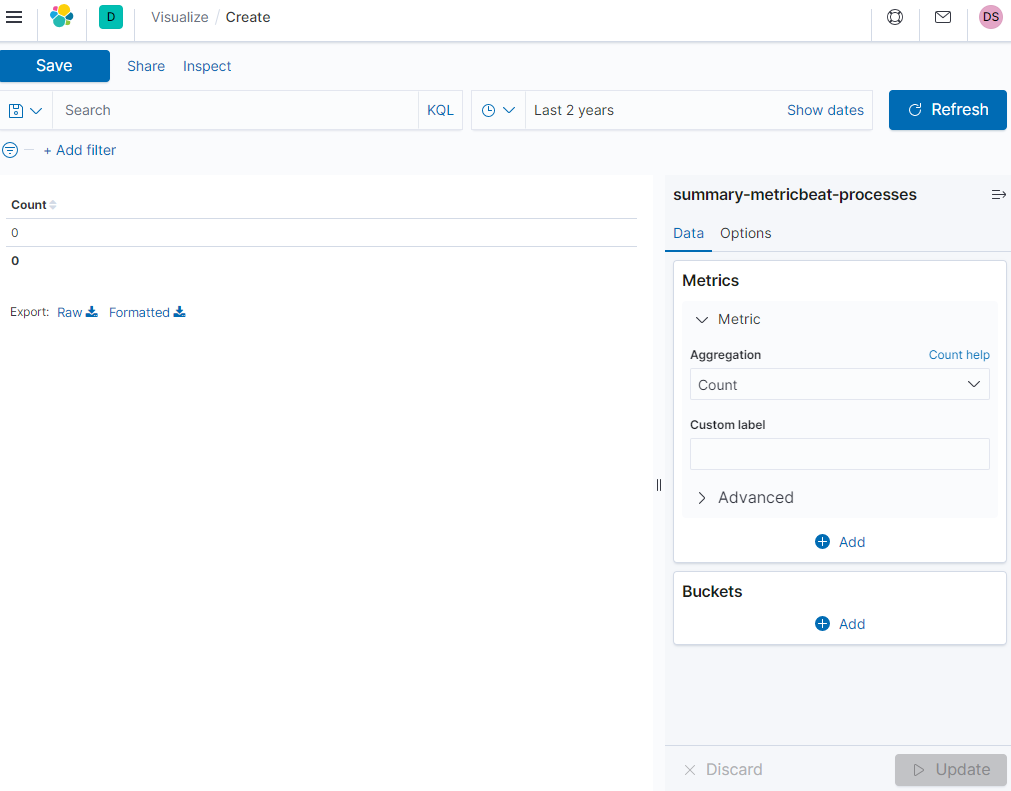
What I'm doing wrong?