Hi,
I use AWS ES. in my case the Elasticsearch aggregate the data from multiple locations like (Cloudwatch, S3,...). the ES works fine but i can't find more available fields in my Kibana console to create the dashboard. any advice...?

have u written the parser for those logs in logstash because i hope ur entire logs are coming in message field
i don't use Logstash. i aggregate the logs by cloudwatch then using Lambda func to load the logs into ES. should i use Logstash to get these fields or i can get it without Logstash ..?
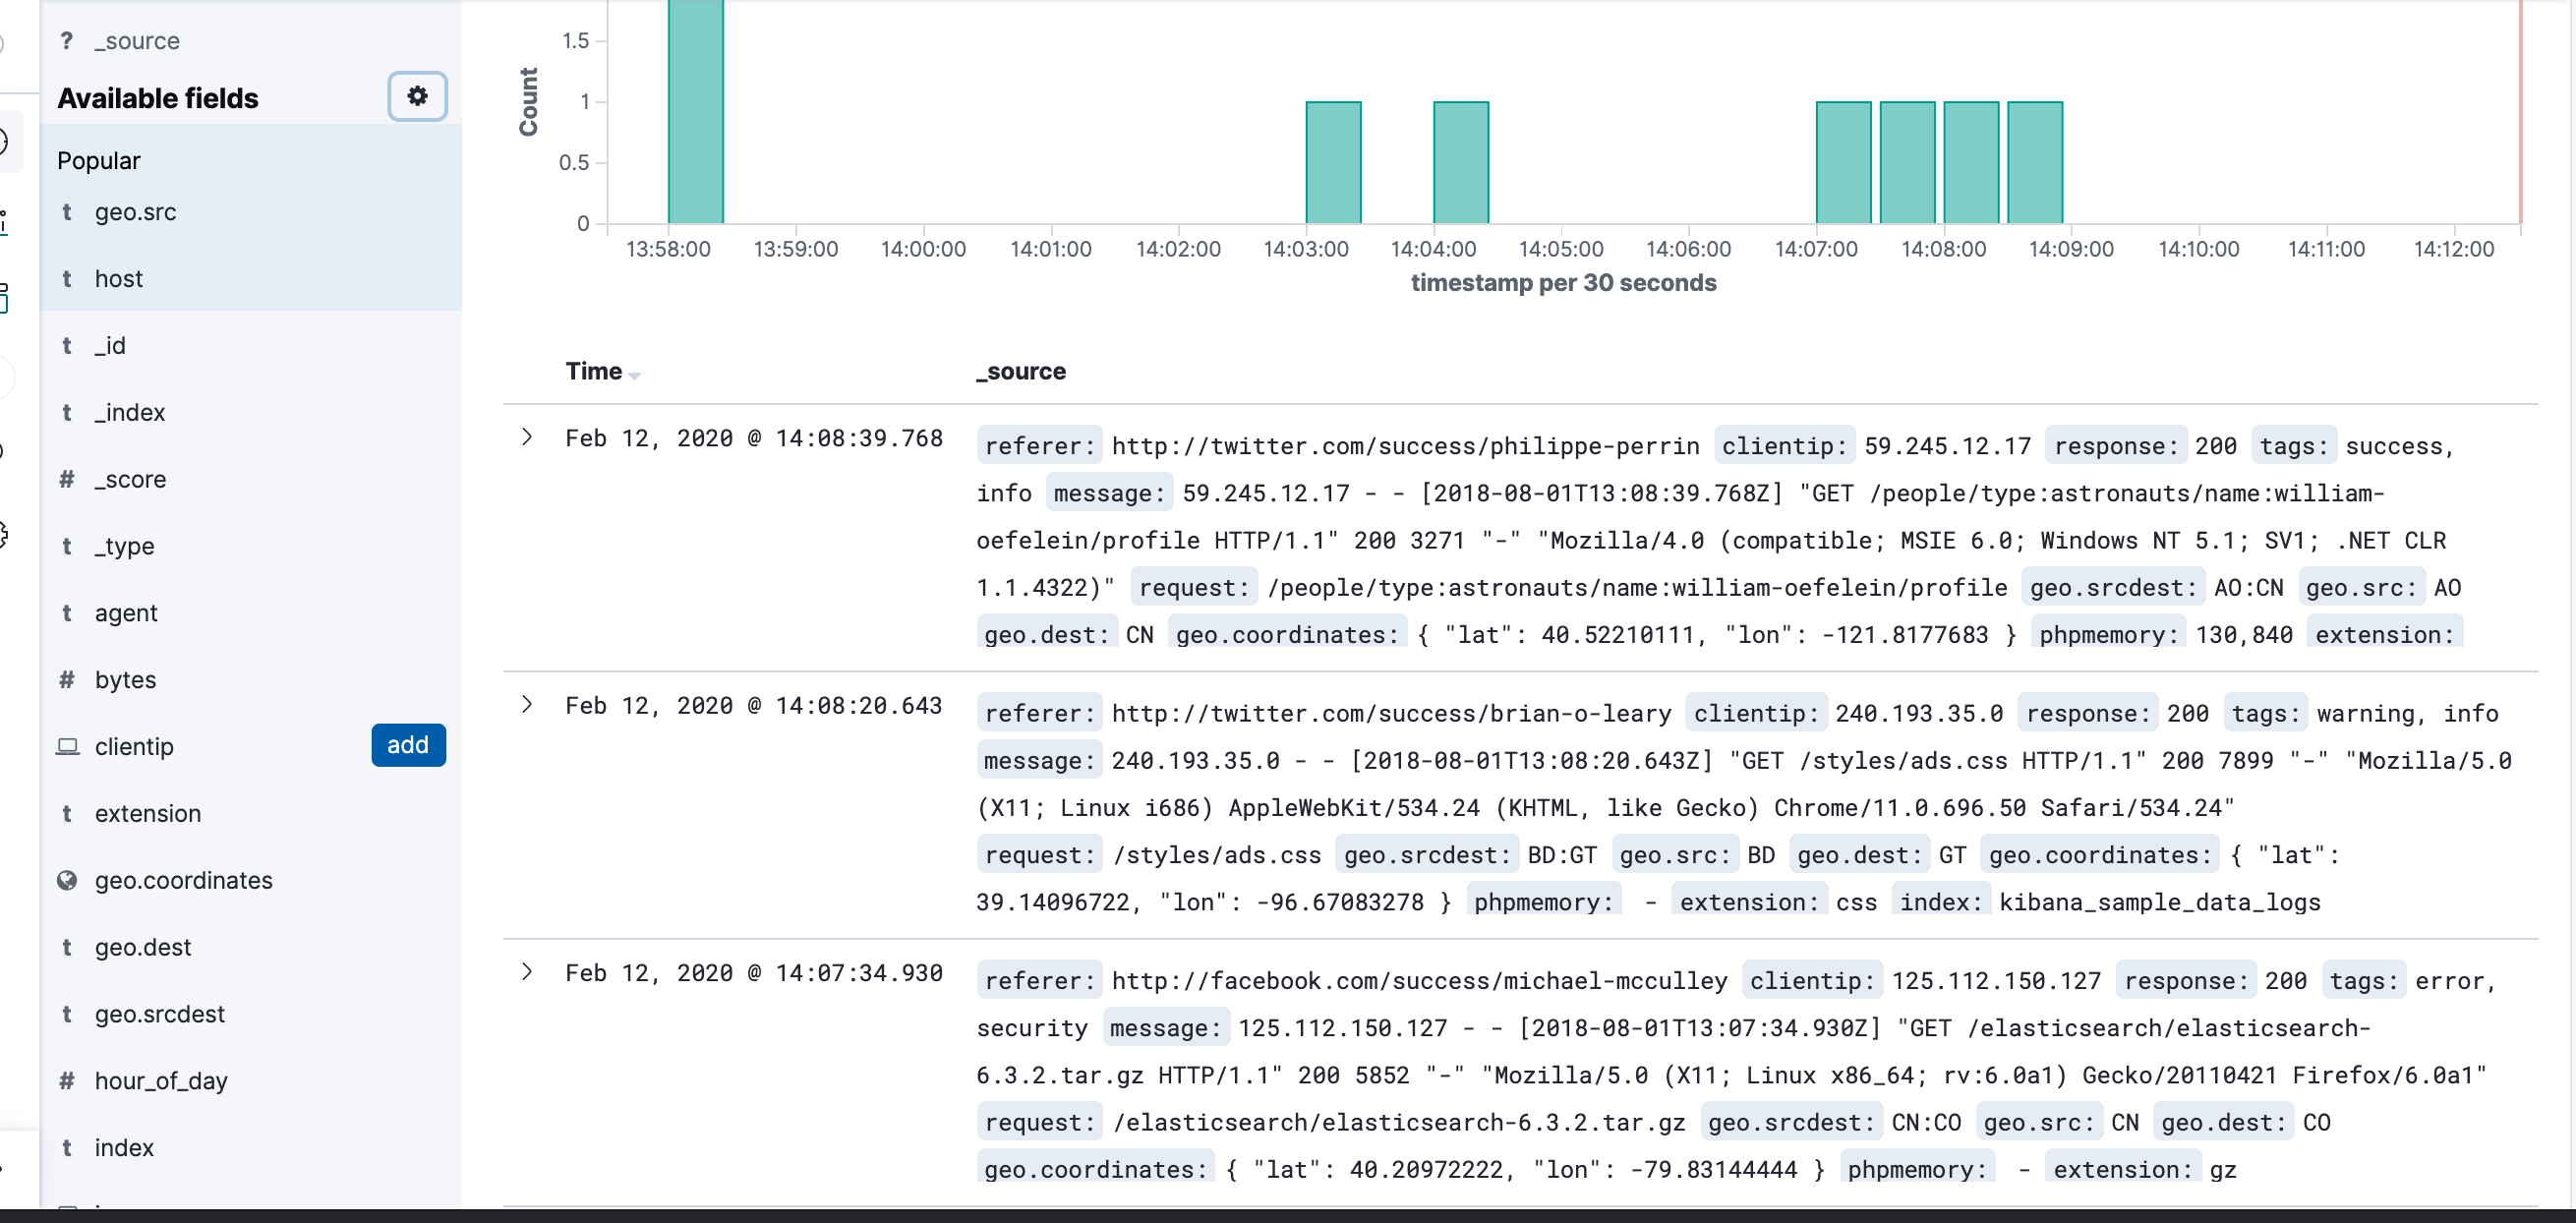
when i load Kibana sample data, i see alot of available field although i am not installed Logstash why i not see in my data