Your aggregation interval is much larger than your bucket span. So within the interval there will be a bucket that contains that value, but you would need to zoom in to see that in the viewer. These are two views of the same data. One is for one day, which uses both aggregation interval and bucket span of 5m. The true value of 3,900,000 is shown (the numbers on the left axis are truncated). The second one shows a week of data, so the aggregation interval grows to 30m, and the value shown drops to about 800,000.
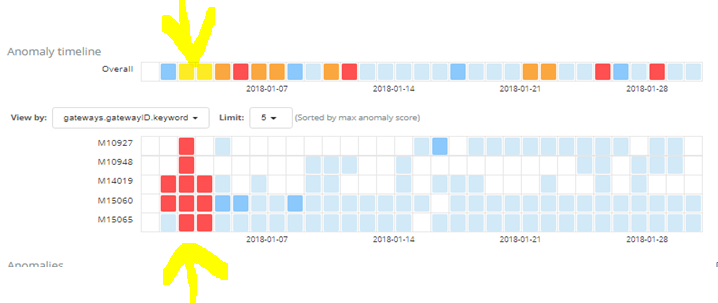
In the Overall, the color is yellow but when i try to visualise using an influencer i get 5 red squares ... There is a contradiction here... whith 5 red i must have in th overall one red also....
The values shown in the expanded row of the anomalies table in the Single Metric Viewer are the typical and actual values observed for the mean(hdopDevice) aggregation used in your detector, over the 30 minute bucket span of your job. It's usually best to ensure the aggregation interval used for plotting the chart matches the bucket span of the job - which you can do by clicking the 'auto' zoom link on the top left of the chart.
As @Badger pointed out, the different components in the Anomaly Explorer view display scores from the various result types. As well as the link mentioned, this blog contains more details on how the anomaly scoring works.
Apache, Apache Lucene, Apache Hadoop, Hadoop, HDFS and the yellow elephant
logo are trademarks of the
Apache Software Foundation
in the United States and/or other countries.