So for instance, each document is an order so if I have 10 documents in my mongo collection, it could be 4 from Nike, 2 from Puma and 4 from Adidas. So in my data table, I want to count the number of orders from each brand. It should be possible by aggregating them and applying a filter on the date.
I managed to do it by adding as many data table elements as there are cells in the screenshot.
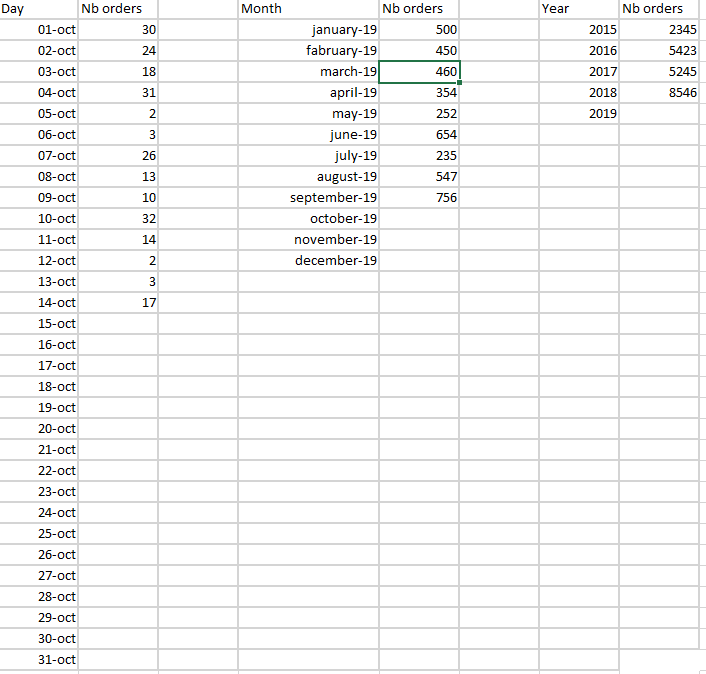
I don't know how to update and calculate the number of days from a timestamp date though. For instance if we are in November, I would like to display 30 rows in the Day column.
Trying to get all three of those things in the same data table seems unreasonable. Is it okay if they are three separate data tables? It should be as simple as
SELECT HISTOGRAM("@timestamp", INTERVAL 1 YEAR) AS year, COUNT(*) AS count FROM "qbserve-*"
GROUP BY year
Apache, Apache Lucene, Apache Hadoop, Hadoop, HDFS and the yellow elephant
logo are trademarks of the
Apache Software Foundation
in the United States and/or other countries.