Hello,
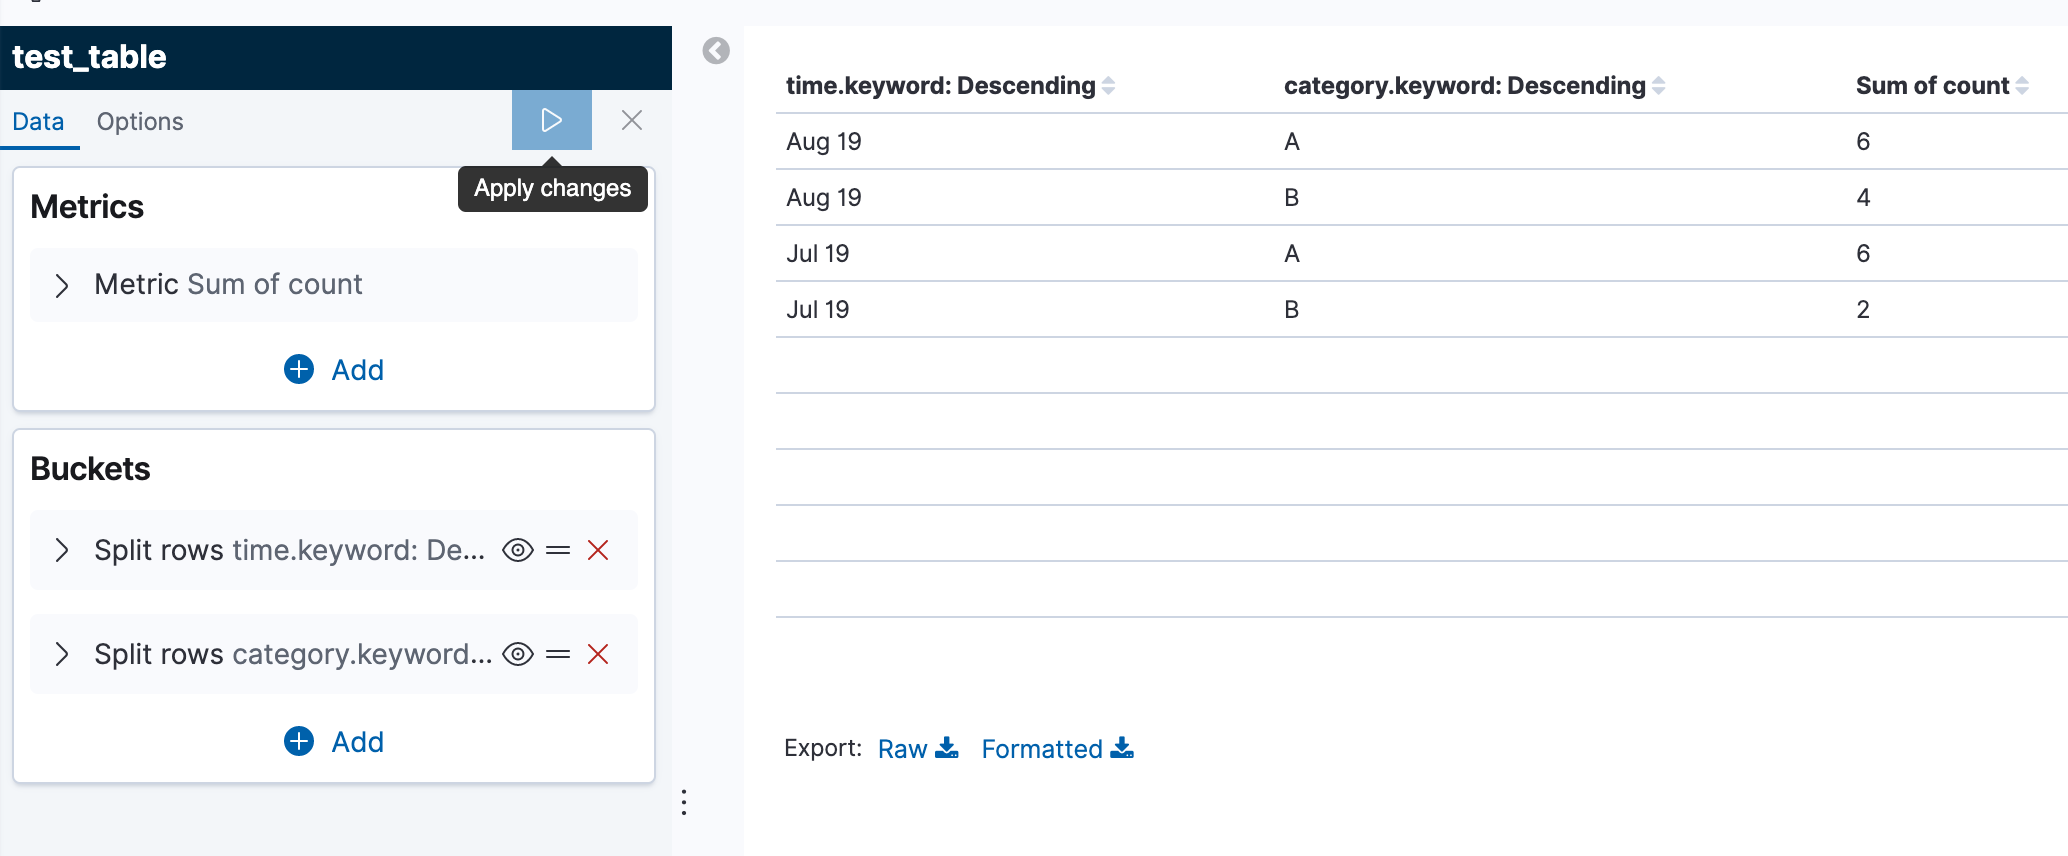
How Can I get this table :

FROM:
Hi @wadhah
I think you can create a data table, specify Sum as metric aggregation on the count field.
Then add a split row on Time (I'm not sure what is the time field format in that case, but I've build an example with a string field using terms agg). Then add another split row bucket on Category (terms aggregation)
with this demo data set
PUT test_table/_doc/1
{
  "time": "Jul 19",
  "count": 1,
  "category": "A"
}

PUT test_table/_doc/2
{
  "time": "Jul 19",
  "count": 5,
  "category": "A"
}

PUT test_table/_doc/3
{
  "time": "Jul 19",
  "count": 2,
  "category": "B"
}

PUT test_table/_doc/4
{
  "time": "Aug 19",
  "count": 6,
  "category": "A"
}


PUT test_table/_doc/4
{
  "time": "Aug 19",
  "count": 6,
  "category": "A"
}

PUT test_table/_doc/5
{
  "time": "Aug 19",
  "count": 3,
  "category": "B"
}

PUT test_table/_doc/6
{
  "time": "Aug 19",
  "count": 1,
  "category": "B"
}
oh, maybe I miss understand the question, was that related to build the table in Canvas?
Thank you @markov00 for the quick update.
Yap I am trying to build in Canvas
And concerning the date I am depending on "timestamp" And I used "mapColumn "time" expression={getCell "time" | formatdate format="MMM YYYY"}" to get in that way
@markov00 Hello again ... I was wondering if there are any updates concerning this topic.
Thank you in advance
@Catherine_Liu can you help us here?
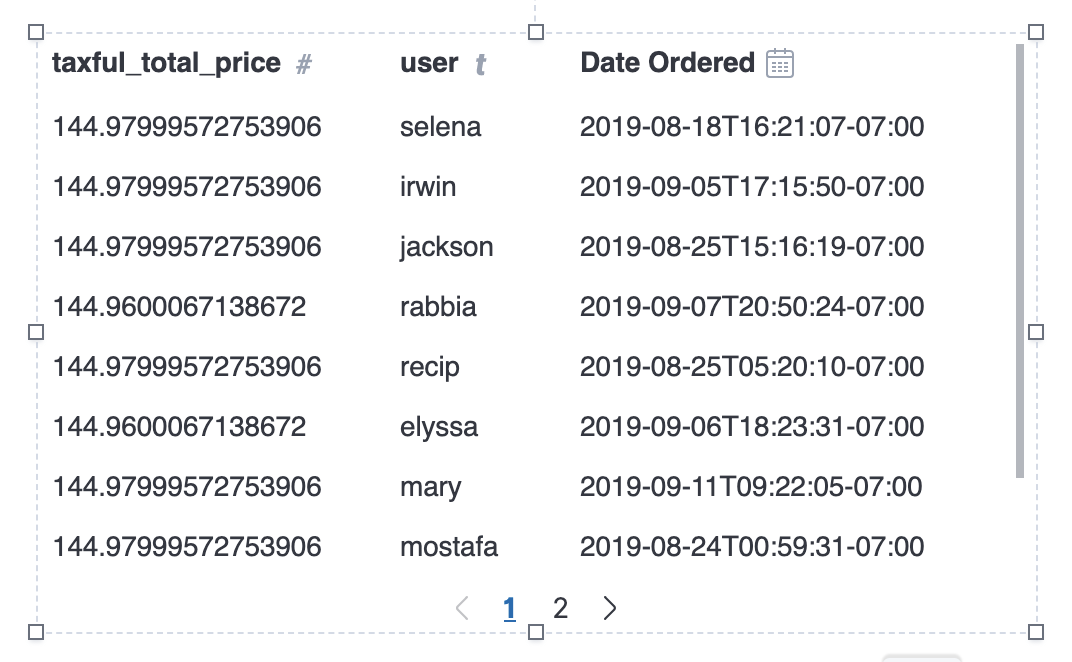
@wadhah The table will display the column names as the table headers. You can style these table headers with CSS to capitalize your column names like this:
If you need more than just a simple text transform, you can rename your columns using alterColumn to display the header you desire.
Here's an example expression:
filters
| esdocs index="cluster_ONE:kibana_sample_data_ecommerce" fields="taxful_total_price, user, order_date"
| alterColumn "order_date" name="Date Ordered"
| table
| render
Note: if you change the name using alterColumn, you'll need to also update any references to this column with the new name in a math expression or plot configuration.
Hello @markov00 and @Catherine_Liu : Thank you so much for the update. However, I think I was not clear about the real issue : In fact I am not looking forward to change "category" to "Category".
So, I have an index which includes : "time", "category" among its fields . And I am trying to build a table as shown in the first picture
But I am getting this table:
I am using these commands:
       "SELECT category, COUNT(category) AS Count, \"@timestamp\"  AS Time
        FROM "index"
        GROUP BY Time, category
        ORDER BY Time ASC"
And in the expression editor I changed the date to the format "MMM YYYY"
Ps: If I get rid of "time" or "category" from the "GROUP BY" section I get an error.
Thank you for your cooperation in advance
Ah sorry, I misunderstood the issue.
You can use the ply function to handle the grouping and aggregation.
Here's an example using the Ecommerce sample data set:
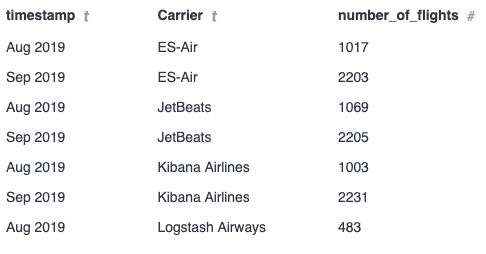
filters
| essql
  query="SELECT timestamp, Carrier, count(*) as number_of_flights FROM \"kibana_sample_data_flights\" GROUP BY Carrier, timestamp"
  count=10000
| mapColumn "timestamp" fn={getCell "timestamp" | formatdate "MMM YYYY"}
| ply by="timestamp" by="Carrier" fn={math "sum(number_of_flights)"}
| table
| render
The ply function here splits up the data into unique sub-datatables per combination of month/year timestamp and Carrier and calculates the sum of the number_of_flights in each sub-datatable. Then it merges the results back into a single datatable with one row per result.
An alternative is to have Elasticsearch handle rounding the date to the month using the HISTOGRAM aggregation, which results in a faster query and possibly more accurate one since the aggregation isn't limited to aggregation only the first 10000 documents like in the expression above. Here's the same example above with a different SQL query with slightly different results:
filters
| essql
  query="SELECT HISTOGRAM(timestamp, INTERVAL 1 MONTH) as month, Carrier, count(*) as number_of_flights FROM \"kibana_sample_data_flights\" GROUP BY Carrier,month" count=10000
| table
| render
© 2020. All Rights Reserved - Elasticsearch
Apache, Apache Lucene, Apache Hadoop, Hadoop, HDFS and the yellow elephant logo are trademarks of the Apache Software Foundation in the United States and/or other countries.