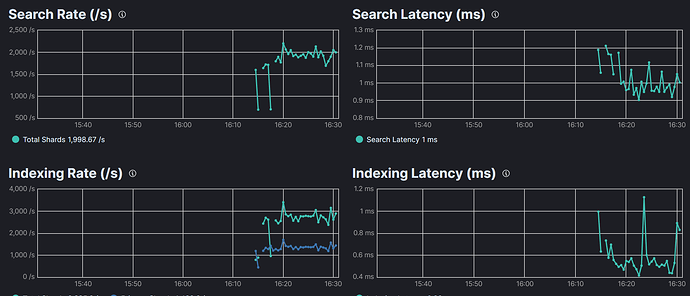
In our monitoring cluster I noticed that the stack monitoring elasticsearch overview page broke after I closed only some indices on a cluster.
Can you define what is broken?
Do you mean that the graphs don't show all the historical data? Which indices did you close?
If you've closed some .monitoring-* indices then this makes sense, the data is no longer readable since the index is closed.
Is there anything else that could cause the data to drop away, such as an ILM policy?
No system, or system adjacent indices were closed.
Nothing else was the cause. Having any amount of closed indices prevented the stack monitoring Elasticsearch overview for that cluster from generating any metrics, aka cluster wide indexing metrics broke.
The picture above is shows the exact moment I got rid of the closed indices.
So your screenshot shows the time period where at first the indices where closed (no data) and then you re-opened or deleted the closed indices (new data coming in)?
That sounds to me like an issue with the metrics generation/collection of the monitored cluster,
not the Stack Monitoring UI (which only displays the data collected).
During the period, did you have any errors in your Metricbeat or Elasticsearch logs (in the production cluster) related to monitoring data collection or a mention of the closed indices?
You're probably running into this issue, or similar. Currently, the way Stack Monitoring collects via Metricbeat/Elastic Agent doesn't not gracefully handle closed indices. If you have 1 or more indices closed, collection of information will fail for the cluster until the index is no longer closed.
Thanks @BenB196 for finding the issue. I'll put that on my to do list to check if I can change which query parameters we use in Metricbeat to avoid collection stopping if there are any closed indices!
