Condition fails on text field in Kibana alert and Action

Hi Community,

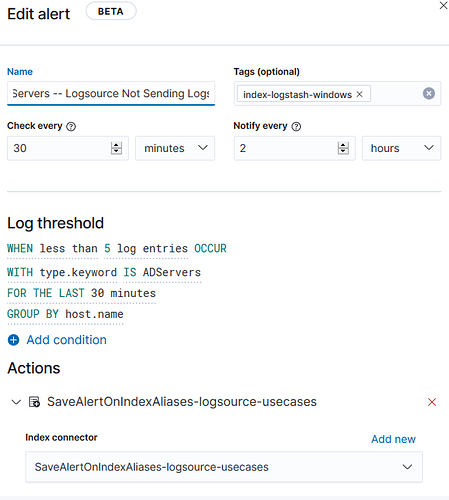
Alert condition and other details are as

In above screenshot,

type.keyword IS ADServers (type field type is string/text in elasticsearch field mapping)

I also tried it too

type IS ADServers (type field type is string/text in elasticsearch field mapping)

type is my custom extracted field using logstash that shows the type of logsource like AD servers here above. host.name field contains name of AD server

Actual Issue:

first condition type.keyword IS ADServers doesn't work. If it works then it should return active directory server names in host.name but it returns all servers in host.name field.

For example, A, B and C are the AD servers, type IS ADServers means it should return results A, B and C because I'm going to group on host.name. But here it's returning results of all servers like A, B, C, D, E, F, .... Z. That means the condition type IS ADServers doesn't work

P.S:
1- I can see both fields in real time logs like type and host.name.
2- If I apply filter like type: ADServers I can see the json documents in kibana on the index
Hi, sorry to see you're having problems with log threshold alerts.

Your mappings and configuration look good, so I'd need to get a better idea of what results would be returned by our alert checking query. Given your configuration this is the full ES query we would run to check the alert:

{
   "index":"logs-*,filebeat-*,kibana_sample_data_logs*",
   "allowNoIndices":true,
   "ignoreUnavailable":true,
   "body":{
      "query":{
         "bool":{
            "filter":[
               {
                  "range":{
                     "@timestamp":{
                        "gte":1599565399519,
                        "lte":1599570799519,
                        "format":"epoch_millis"
                     }
                  }
               }
            ]
         }
      },
      "aggregations":{
         "groups":{
            "composite":{
               "size":40,
               "sources":[
                  {
                     "group-0-host.name":{
                        "terms":{
                           "field":"host.name"
                        }
                     }
                  }
               ]
            },
            "aggregations":{
               "filtered_results":{
                  "filter":{
                     "bool":{
                        "filter":[
                           {
                              "range":{
                                 "@timestamp":{
                                    "gte":1599567199519,
                                    "lte":1599568999519,
                                    "format":"epoch_millis"
                                 }
                              }
                           },
                           {
                              "term":{
                                 "type.keyword":{
                                    "value":"ADServers"
                                 }
                              }
                           }
                        ]
                     }
                  }
               }
            }
         }
      },
      "size":0
   }
}

Please note, the index property would be set to whatever you have set under "Log indices" on your Logs > Settings page. The range lte and gte values would also coincide with the time the alert check executes.

Please could you take the body of this query and run it in Dev tools > Console. E.g.

You'll need to tweak those aforementioned index and range lte / gte values.

And then paste the result (from the right hand panel) here. Feel free to redact / change any private information (e.g. if your host.name values can't be posted here).

Your results should look something like the following:

{
  "took" : 0,
  "timed_out" : false,
  "_shards" : {
    "total" : 1,
    "successful" : 1,
    "skipped" : 0,
    "failed" : 0
  },
  "hits" : {
    "total" : {
      "value" : 665,
      "relation" : "eq"
    },
    "max_score" : null,
    "hits" : [ ]
  },
  "aggregations" : {
    "groups" : {
      "meta" : { },
      "after_key" : {
        "group-0-host.name" : "HostA"
      },
      "buckets" : [
        {
          "key" : {
            "group-0-host.name" : "HostA"
          },
          "doc_count" : 665,
          "filtered_results" : {
            "meta" : { },
            "doc_count" : 0
          }
        }
      ]
    }
  }
}

We'll hopefully have easier ways to debug alerting queries soon.

Hi @Kerry,

Thank you for your detailed reply. Let me explain following items:

1- Kibana Logs > Settings > Log indices (I've added the index pattern like logstash-windows-* and verified that logs are coming on real time and I can also see correct results on applying filters like type.keyword:ADServers I can see correct hostnames of ADServers filter. So that's not an issue)

2- I've run your provided elasticsearch query and queried on index pattern logstash-windows-*. It returns false results. Here are the details:

Query

GET logstash-windows-*/_search
{
"query":{
"bool":{
"filter":[
{
"range":{
"@timestamp":{
"gte":1599565399519,
"lte":1599570799519,
"format":"epoch_millis"
}
}
}
]
}
},
"aggregations":{
"groups":{
"composite":{
"size":40,
"sources":[
{
"group-0-host.name":{
"terms":{
"field":"host.name"
}
}
}
]
},
"aggregations":{
"filtered_results":{
"filter":{
"bool":{
"filter":[
{
"range":{
"@timestamp":{
"gte":1599567199519,
"lte":1599568999519,
"format":"epoch_millis"
}
}
},
{
"term":{
"type.keyword":{
"value":"ADServers"
}
}
}
]
}
}
}
}
}
},
"size":0
}

Response:

{
"took" : 1721,
"timed_out" : false,
"_shards" : {
"total" : 11,
"successful" : 11,
"skipped" : 0,
"failed" : 0
},
"hits" : {
"total" : {
"value" : 10000,
"relation" : "gte"
},
"max_score" : null,
"hits" :
},
"aggregations" : {
"groups" : {
"meta" : { },
"after_key" : {
"group-0-host.name" : "hostname_value_is_here"
},
"buckets" : [
{
"key" : {
"group-0-host.name" : "hostname_value_is_here"
},
"doc_count" : 7199,
"filtered_results" : {
"doc_count" : 0
}
},
{
"key" : {
"group-0-host.name" : "hostname_value_is_here"
},
"doc_count" : 9016,
"filtered_results" : {
"doc_count" : 2763
}
},
{
"key" : {
"group-0-host.name" : "hostname_value_is_here"
},
"doc_count" : 18715,
"filtered_results" : {
"doc_count" : 6459
}
},
{
"key" : {
"group-0-host.name" : "hostname_value_is_here"
},
"doc_count" : 76113,
"filtered_results" : {
"doc_count" : 22998
}
},
{
"key" : {
"group-0-host.name" : "hostname_value_is_here"
},
"doc_count" : 870,
"filtered_results" : {
"doc_count" : 0
}
},
{
"key" : {
"group-0-host.name" : "hostname_value_is_here"
},
"doc_count" : 90407,
"filtered_results" : {
"doc_count" : 0
}
},
{
"key" : {
"group-0-host.name" : "hostname_value_is_here"
},
"doc_count" : 838,
"filtered_results" : {
"doc_count" : 0
}
},
{
"key" : {
"group-0-host.name" : "hostname_value_is_here"
},
"doc_count" : 121399,
"filtered_results" : {
"doc_count" : 20764
}
},
{
"key" : {
"group-0-host.name" : "hostname_value_is_here"
},
"doc_count" : 321,
"filtered_results" : {
"doc_count" : 0
}
},
{
"key" : {
"group-0-host.name" : "hostname_value_is_here"
},
"doc_count" : 752,
"filtered_results" : {
"doc_count" : 0
}
},
{
"key" : {
"group-0-host.name" : "hostname_value_is_here"
},
"doc_count" : 1269,
"filtered_results" : {
"doc_count" : 0
}
},
{
"key" : {
"group-0-host.name" : "hostname_value_is_here"
},
"doc_count" : 47343,
"filtered_results" : {
"doc_count" : 0
}
}
]
}
}
}

3- Here is the kibana visualization results that returns correct results as being shown in the screenshot below. Here I'm applying filter of type.keyword:ADServers, it return correct results of host.name field

Kibana Visualization Results:

@Kerry elasticsearch query response is returning false results. Here in kibana visualization, you're seeing that if I filter on type.keyword:ADServers it's returing results like HQAD01, HQAD02 ... but elasticsearch query is returning all host.name values that are coming on index pattern logstash-windows- it means filter type.keyword:ADServers is not working but in kibana visualization and Discover, filter type.keywork:ADServer or filter type:ADServers return correct results.

Thank you very much Ma'am.

Thanks for the reply @msszafar, I see the issue now.

The query and results are working as intended, however that doesn't align with the expectation you have with your configuration, which is something we'll need to fix going forward. We have some enhanced documentation coming soon which would hopefully also make this clearer. And there are some possible enhancements we could make to make this use case you have possible.

The WITH criteria are a filter on the documents, but not the grouping. When a grouping is set, in this case host.name, we perform a composite aggregation gathering buckets for all the host.name groups, there's no filtering applied at this level other than the time range. So this will collect all your hosts, regardless of type.

Then we perform an inner filter on those results, using the criteria set, so in this case that's the type.keyword IS ADServers. Here this means we are looking across all of your host names, and then ascertaining how many documents for that host match type.keyword IS ADServers. We can see from the results you posted that's lots of host names with "filtered_results" : {"doc_count" : 0}, and that 0 then matches with less than 5.

It works this way as flipping it around, and applying the filtering to the composite aggregation for the groups, would mean a lot of configurations would be impossible. Eager filtering would mean in a lot of configurations we'd "lose" the groups as the document would be filtered out, and we'd then not be able to fire an alert.

I hope this makes the difference clearer. Going forward I will discuss with the team adding the ability to actually apply a filter to the grouping itself. The way I see this working would be GROUP BY host.name WITH FILTER type IS ADServers, something like that.

Thank you very much @Kerry!

Here our expectation is to get an alert if a logsource (host.name) stop sending logs. For example,

we have type: ADServers that contains following logsources

  1. HQAD01

  2. HAQD02

  3. HQAD03

If HAAD01 stops sending logs than we had tried following options like

FIRST OPTION:
image

This option didn't work because when host.name:HQAD01 stops sending logs then host.name: HQAD01 will not appear in the real time logs but we were applying filter in host.name: HQAD01. Filter means if that value in that field will appear then it will apply filter. So this logic was failed and didn't work.

SECOND OPTION
image
This option also didn't work because logic was wrong. GROUP BY host.name means group all host.name field of realtime logs. We were assuming that it will first filter on When less than 5 log entries occur within last 30 minutes type:ADServers and then will group the filtered results by host.name. But your point is valid, it just group the field and filter is something else. If we apply group by host.name first and then apply filter on it then it could have returned the desired results, but this option is still not available.

THIRD OPTION:
third

But here for example host.name is HQAD01 event count is less than 5 then it should have triggered the alert but I think event count of group by host.name doesn't check the WHEN condition like WHEN less than 5 log entries OCCUR.

Could you please suggest any work around that return our desired results?

Thank you

Hi,

Sure, let's try and get a working configuration, which addresses the case host.name HAAD01 stops sending logs.

Option two and option three (as you've said) will not work for this use case, as:

  • Filtering is applied to the documents, not the grouping.
  • This use case ("stops sending logs") is sensitive to values being 0. If no documents exist with the field we're grouping by (host.name) then we have no awareness of the groups. There is more on this here.

Group by is well suited to scenarios where the field you're grouping by exists on the documents, and then you want to ascertain something about the documents that sit within the grouping.

The preferred option for this use case would be option 1, as this can provide accuracy around 0 (or "no logs"). You said this option didn't work, but I don't think I fully understood your reasoning why?

This option didn't work because when host.name:HQAD01 stops sending logs then host.name: HQAD01 will not appear in the real time logs

This is correct, and expected behaviour.

but we were applying filter in host.name: HQAD01 . Filter means if that value in that field will appear then it will apply filter. So this logic was failed and didn't work.

I don't understand this part?

The ES query your option 1 would execute is:

{
   "index":"logs-*,filebeat-*,kibana_sample_data_logs*",
   "allowNoIndices":true,
   "ignoreUnavailable":true,
   "body":{
      "track_total_hits":true,
      "query":{
         "bool":{
            "filter":[
               {
                  "range":{
                     "@timestamp":{
                        "gte":1599732844889,
                        "lte":1599734644889,
                        "format":"epoch_millis"
                     }
                  }
               },
               {
                  "term":{
                     "type":{
                        "value":"ADServers"
                     }
                  }
               },
               {
                  "term":{
                     "host.name":{
                        "value":"HAAD01"
                     }
                  }
               }
            ]
         }
      },
      "size":0
   }
}

And the result of this query (hits.total.value) would be compared against your less than 5 threshold. Provided you have less than 5 documents where the field type is ADServers AND host.name is HAAD01 this will fire.

We also have "Uptime monitor status" alert types if you run Uptime on your hosts. These alerts can tell you when a host is down. Although, of course, "no logs" doesn't necessarily mean the host is "down".

Thank you very much Ma'am @Kerry for helping us out.

I would request you to please add any default feature in the form of signal rule / kibana alert or anything that could intimate us if any logsource stop sending logs as QRadar or any other SIEM does.

This is the most important feature that we or any other security analyst demands because we as a SOC analyst are responsible to analyze the logs of multiple devices and if due to any reason, we didn't receive logs in Elasticsearch then there should have anything configure that could intimate us if device stops sending logs.

For now, we're achieving similar functionality using the following rule condition:

Thank you

This topic was automatically closed 28 days after the last reply. New replies are no longer allowed.