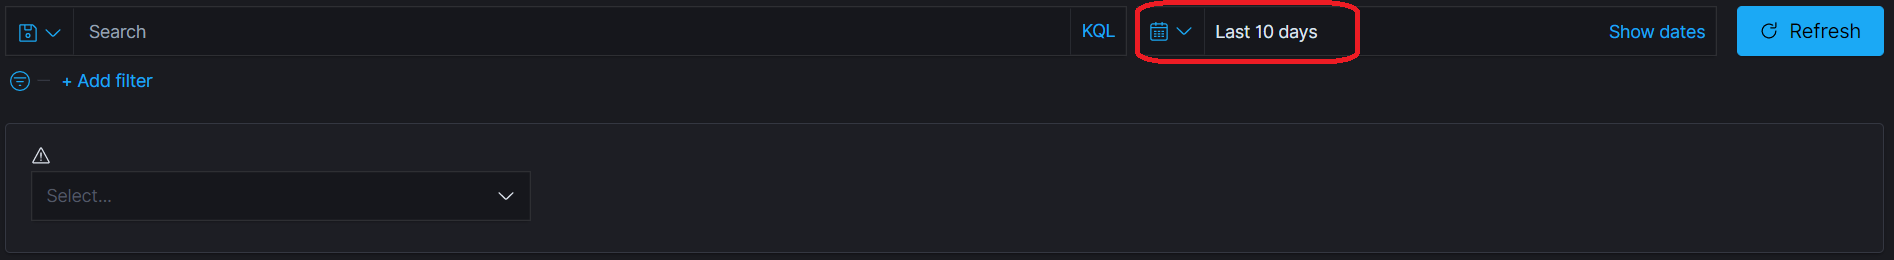
I compared the presented elements of the control visualizations regarding the applied time filter.
In my understanding, all presented elements of the control visualization with the time filter "for the last 10 days" should exist in the list of the presented elements of the control visualization with the time filter "a year ago to now".
Unfortunately, this is not the case. I have found elements in the selection of the control visualization with the time filter "for the last 10 days" which do not exist in the list of the presented elements of the control visualization with the time filter "a year ago to now".
Can somebody please explain why this happens?
Is this a bug or something? How can I solve this issue? I do not want this kind of behaviour!
These are the settings of the control visualisation:
Since you don't have the Use time filter option enabled under Options, I don't believe the elements that populate the control should change at all when you change the time span.
Does the field that you're using for the control have a very large number of possible values across your entire dataset? I wonder if that is causing a problem, given the error in your last screenshot, and you're getting a partial list each time. Does enabling Use time filter help?
When I enable the Use time filter option for the control visualisation, which time filter will the visualisation use? The time filter from the control visualisation or the time filter in the Dashboard, where I installed the control visualisation?
Oh yes! 1000 possible values.
Unfortunately, it did not help to activate the Use time filter option for the control visualisation. From the 300 possible values which the control visualisation should show, I can only select 50 random possible values.
It seems to me that the control visualisation is not working correctly.
Apache, Apache Lucene, Apache Hadoop, Hadoop, HDFS and the yellow elephant
logo are trademarks of the
Apache Software Foundation
in the United States and/or other countries.