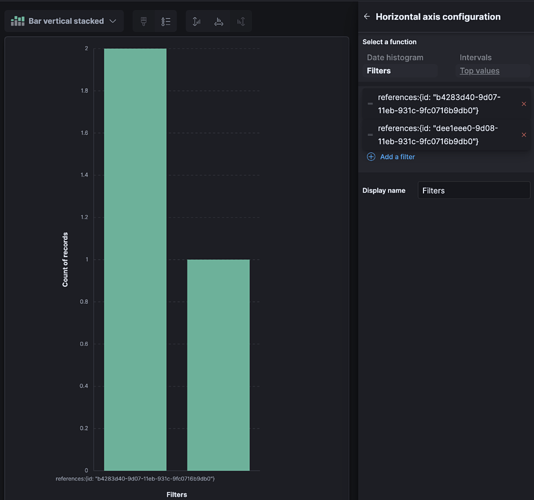
I'm creating dashboards in Kibana 7.11.2 for multiple types of event from a single application. In the data I'm working with, the event types are characterized by different values of a field named tableName. While there is a common set of field across all values of tableName, events for each tableName also have their own unique set of fields.
I'm working through the event types, creating dashboards for each of them. For now, the dashboards are single-type, but I'll likely also create "mashup" dashboards, combining different event types.
I want to keep track of which event types I've covered. Ideally, I'd like to have a dashboard for this purpose.
I already have a dashboard that shows the range of tableName values for which I have data.
And I've started tagging the saved objects in Kibana, where the tag names match the corresponding tableName.
I want to visualize these tags.
For example, ideally, I'd like to enhance my current chart, that shows the range of tableName values, to also show the number of saved objects tagged with that table name. So I can see, at a glance, which tables I've created visualizations for.
I've created an index pattern for the .kibana index. In the Discover tab, I can view the JSON of the saved objects. For example, I can see the tag.name field values.
However, I'm having trouble visualizing fields in that index pattern.
Ideally, I'd like to add another layer to the existing lens that visualizes tableName values, but the Kibana Lens UI doesn't show tag.name in the list of available fields.
I've tried creating an aggregation-based visualization using the .kibana index pattern, but I've run into issues there, too. I can go into detail, if asked.
Looking ahead, if I can visualize data in the .kibana index, I'd like to be able to visualize saved objects by tag name. The hurdle there is that saved objects refer to the ID of the tag, rather than the tag name, and it's not clear to me how to resolve that indirection to the tag name.
I'd welcome advice on how to do this.

