I'm having a dataset fed from my database into an index which I created using logstash. I'm trying to create a table data visualization through Kibana for the data set available.
I've got to create a table data in Kibana which should look more a like this.

In the above image I could simply get the date and the month seperately. The next column (num of Txn) is an aggregation from a groupby which contains the total hits of a particular userid, a string value. The other columns, (Gross Transaction Val) is a sum of a field (chargeamount) which is a string value and the other columns are response code counts for a particular userid in db.
I tried creating the table using metrics and buckets, but couldn't get it done completely. These are some snapshots of what I tried:
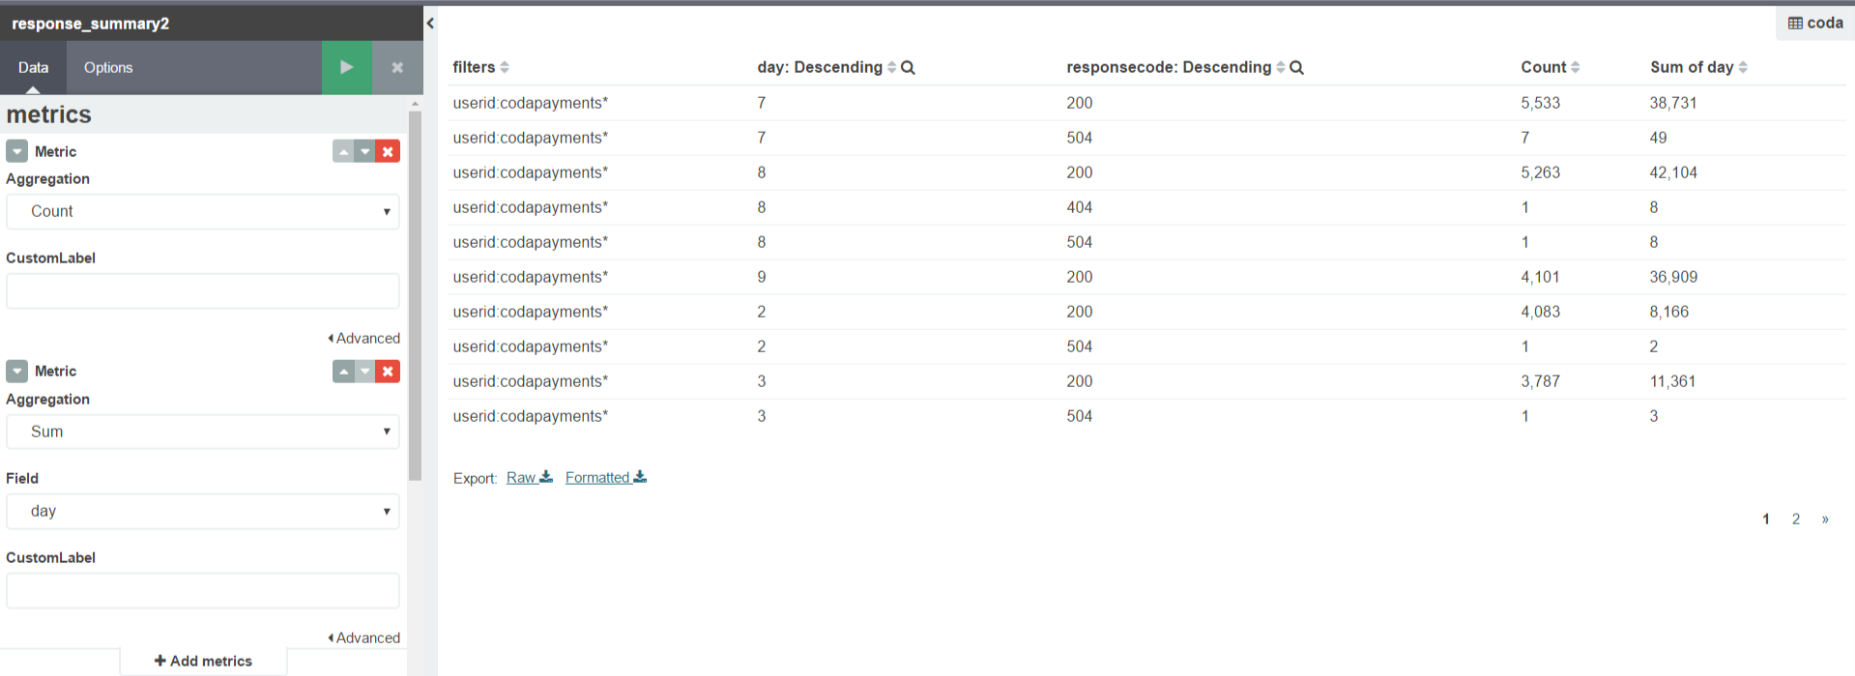
The sub buckets:

These are the issues:
- I'm having a date and month fields separately. But is it possible to append both of them together in
Kibana? - How can I get a
count metricbeing applied to aStringvalue? Is there a way
that I could convert it tointthroughKibana? - Is
groupbyclause inMySQLequal to aggregation buckets in
Kibana?
Where am I going wrong? Any help could be appreciated.