You know what sounds like pleasant technical reading during the holidays? A whole bunch of pretty visualizations!
I recently started managing Kubernetes. Although it makes my life as an operations engineer loads easier, Kubernetes still needs some care and feeding — keeping an eye on all of those workloads, logs, and metrics is a non-trivial exercise. That's why Kubernetes metadata for Beats is such a wonderful thing. Yes, I work for Elastic, but I would unreservedly recommend using Beats, Elasticsearch, and Kibana to monitor Kubernetes in a heartbeat no matter who you are.
I'm not going to tell you why it's so great, though — I'm going to show you (with a real-world Kubernetes cluster).
Getting Started
Well, I'll say a little bit more. If you're a kubernaut (and I'll assume you are from here on out), running these DaemonSets on your cluster is sufficient to start collecting data. You'll need the rest of the stack running somewhere to store documents for each Beat and use Kibana, but the rest is pretty hands-off. The aforementioned DaemonSets encapsulate the necessary settings to let Filebeat and Metricbeat pull in the requisite data.
A Kuber-Wonderland
Let's start with the default Kubernetes dashboard that ships with Beats.

As you can see, our cluster doesn't have a whole lot of changes going on. We've got Deployments, Pods, and more available from this overview page. If we scroll down, there's also a summary of CPU and memory-intensive Pods. Here's what the memory one looks like:
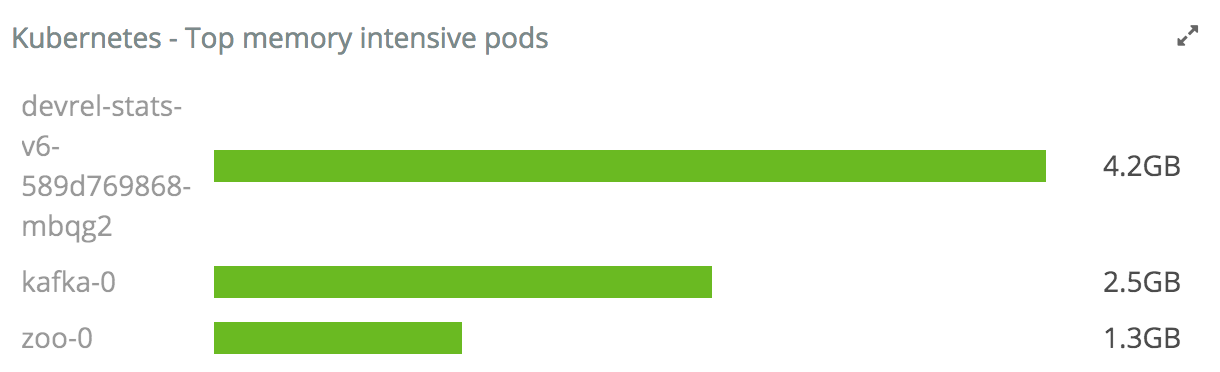
At a glance, we have a pretty good overview of what the cluster is up to. Moreover, there are useful node-level visualizations as well, such as this one that shows overall CPU usage per-node.

Let's dig deeper, shall we?
Time Series
Metricbeat collects a whole slew of metricsets from each Pod and container running in Kubernetes. Check out how we can visualize the memory, CPU, and network activity of arbitrary workloads:
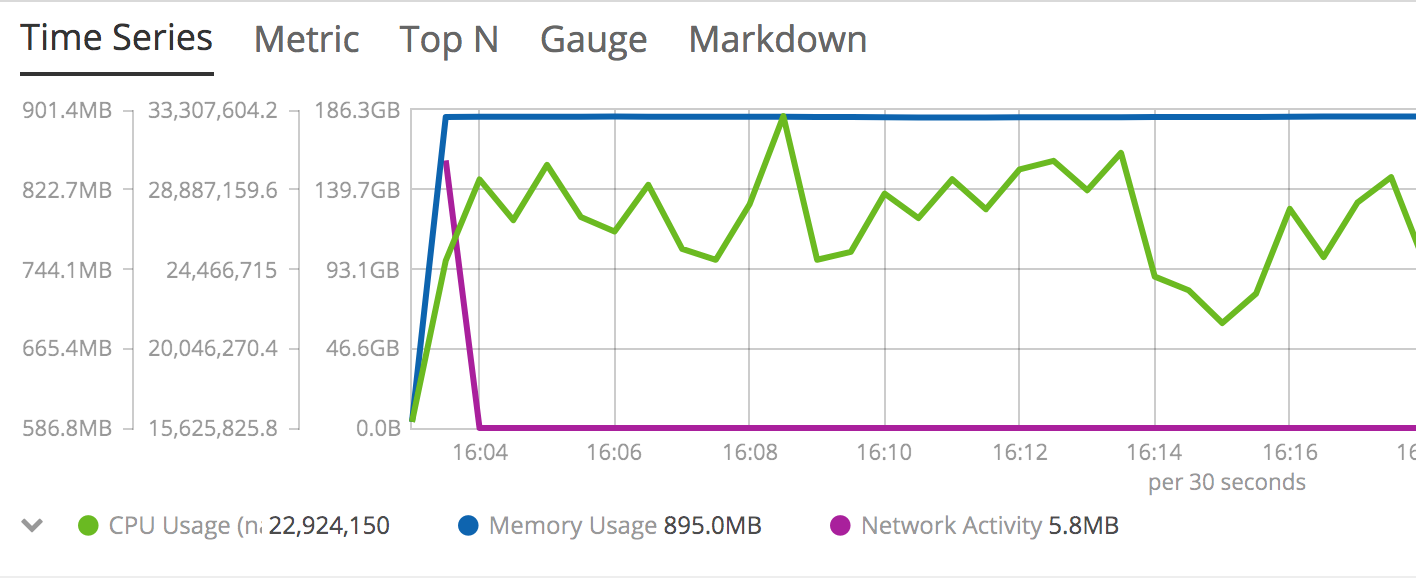
This just shows how a Pod or container's resource consumption changes over time. Note that, because we can apply arbitrary filters to the data, that visualization could summarize a) the cluster overall, b) a single namespace, or even c) a single pod.
In addition to simple resource usage, Metricbeat also tracks both limits and requests for resources like CPU and memory. You could, for example, create a timeseries chart to visualize how your actual CPU usage compares to CPU requests and your overall CPU limit:

Here we see that we could probably tune our CPU requests to make them more accurate, and more efficiently pack workloads onto the underlying nodes.
Insights
Because the data being collected understands both namespaces and the physical nodes Kubernetes runs on, we can create some very interesting and useful visualizations.
Consider this heat map:
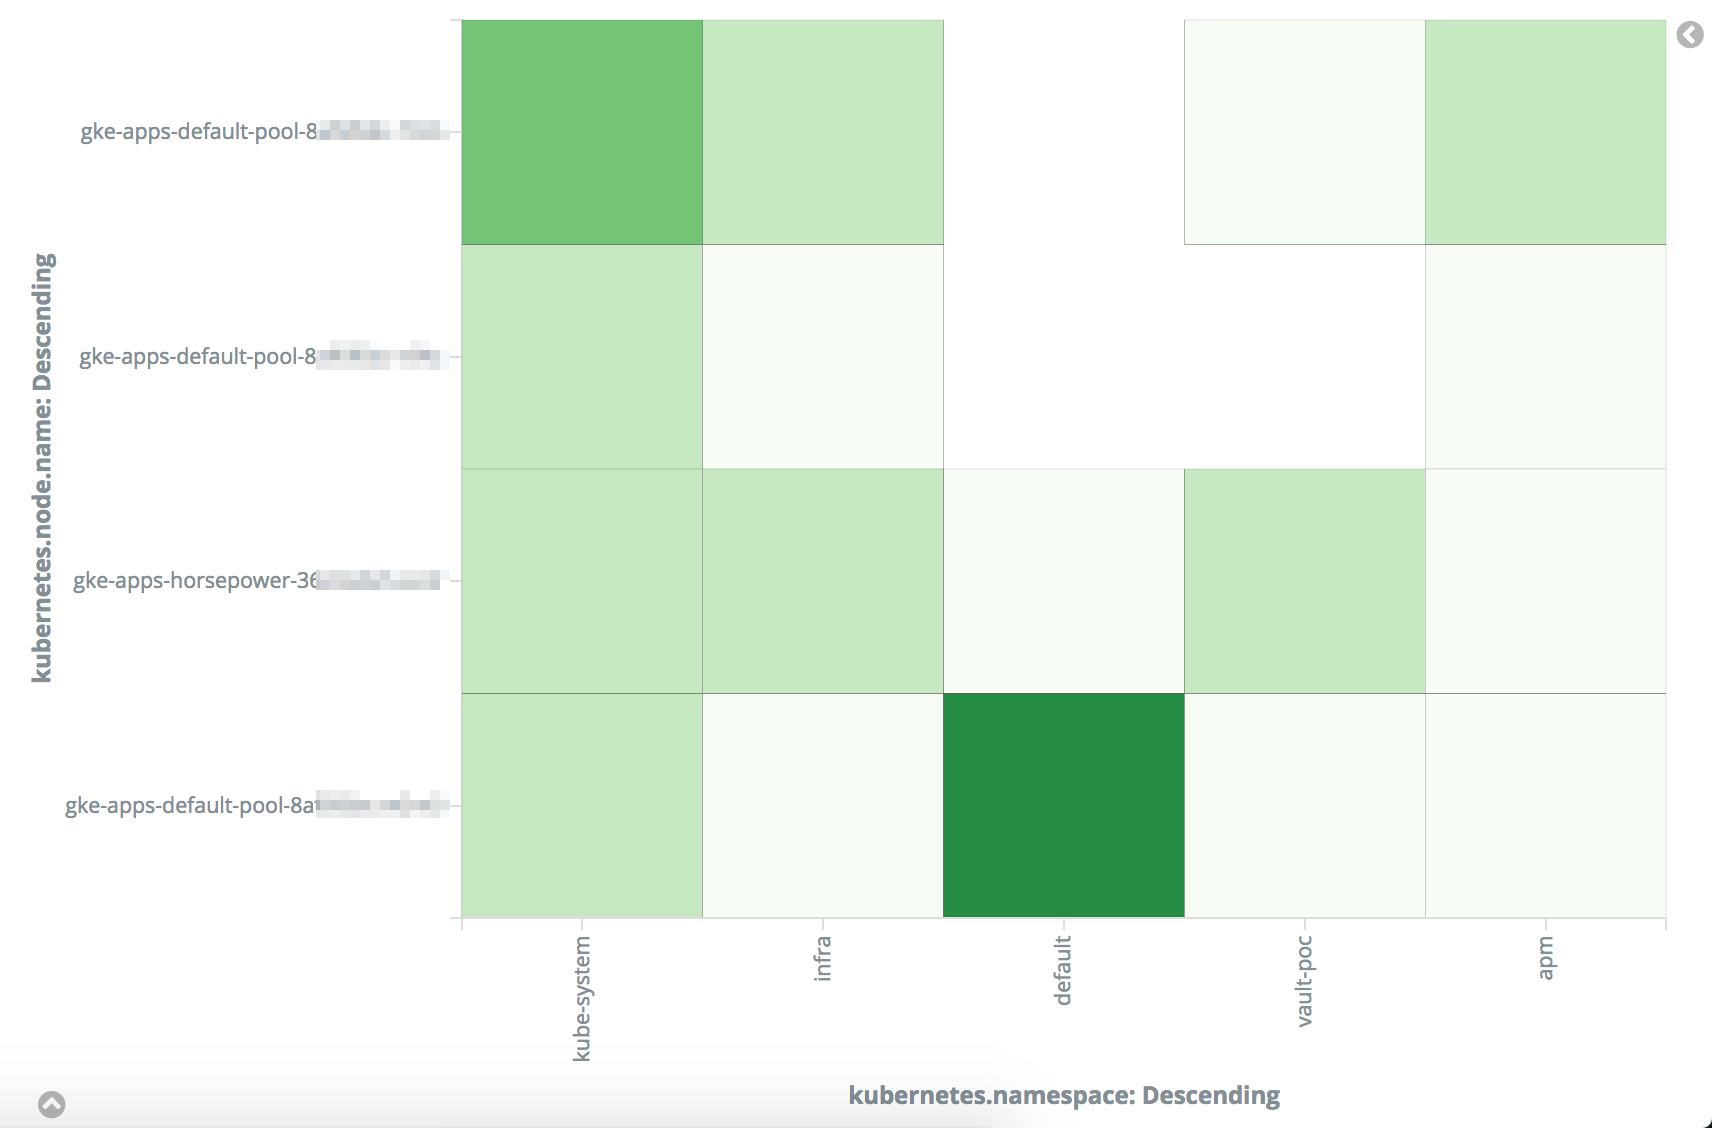
This plots physical nodes against namespace by CPU usage in nanocores. The darker squares represent higher CPU use for a given namespace on a node. Looking at this heat map, we can easily see that the default namespace is using a lot of CPU on our node with an ID beginning with 8a. If we needed to balance load or trim down workloads, looking for pods on that node in the default namespace would be a good place to start.
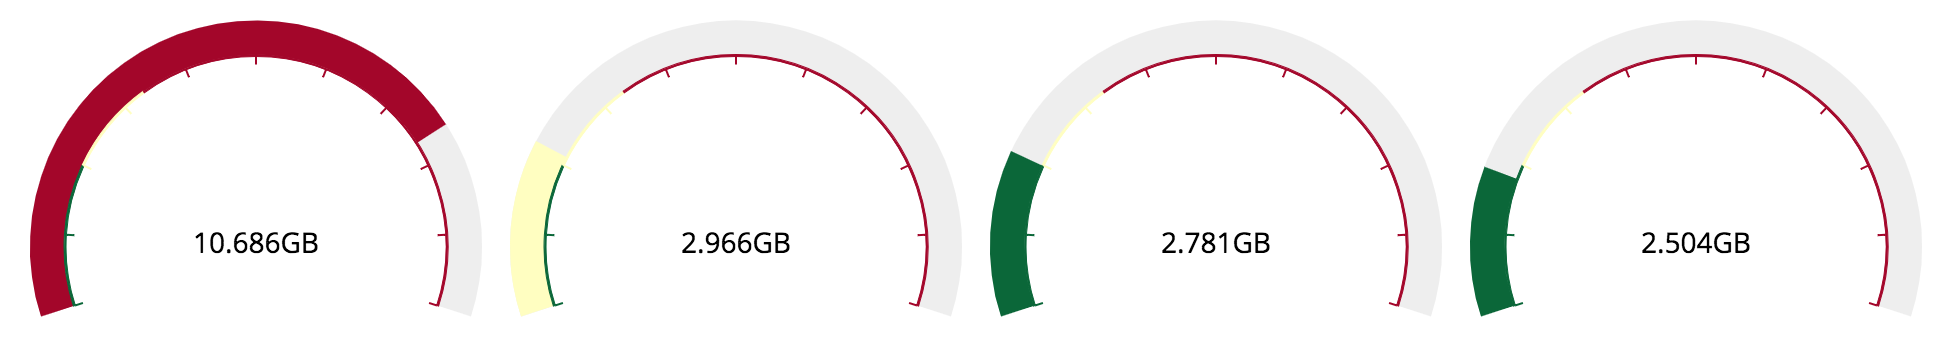
On the topic of heatmaps, perhaps you're interested in how full your pods' volumes are?

Or maybe you need to get a summary of how full up your nodes are on memory requests?
One of the best things about aggregating your data in Elasticsearch is that metrics and logs are side-by-side. Consider the following dashboard:
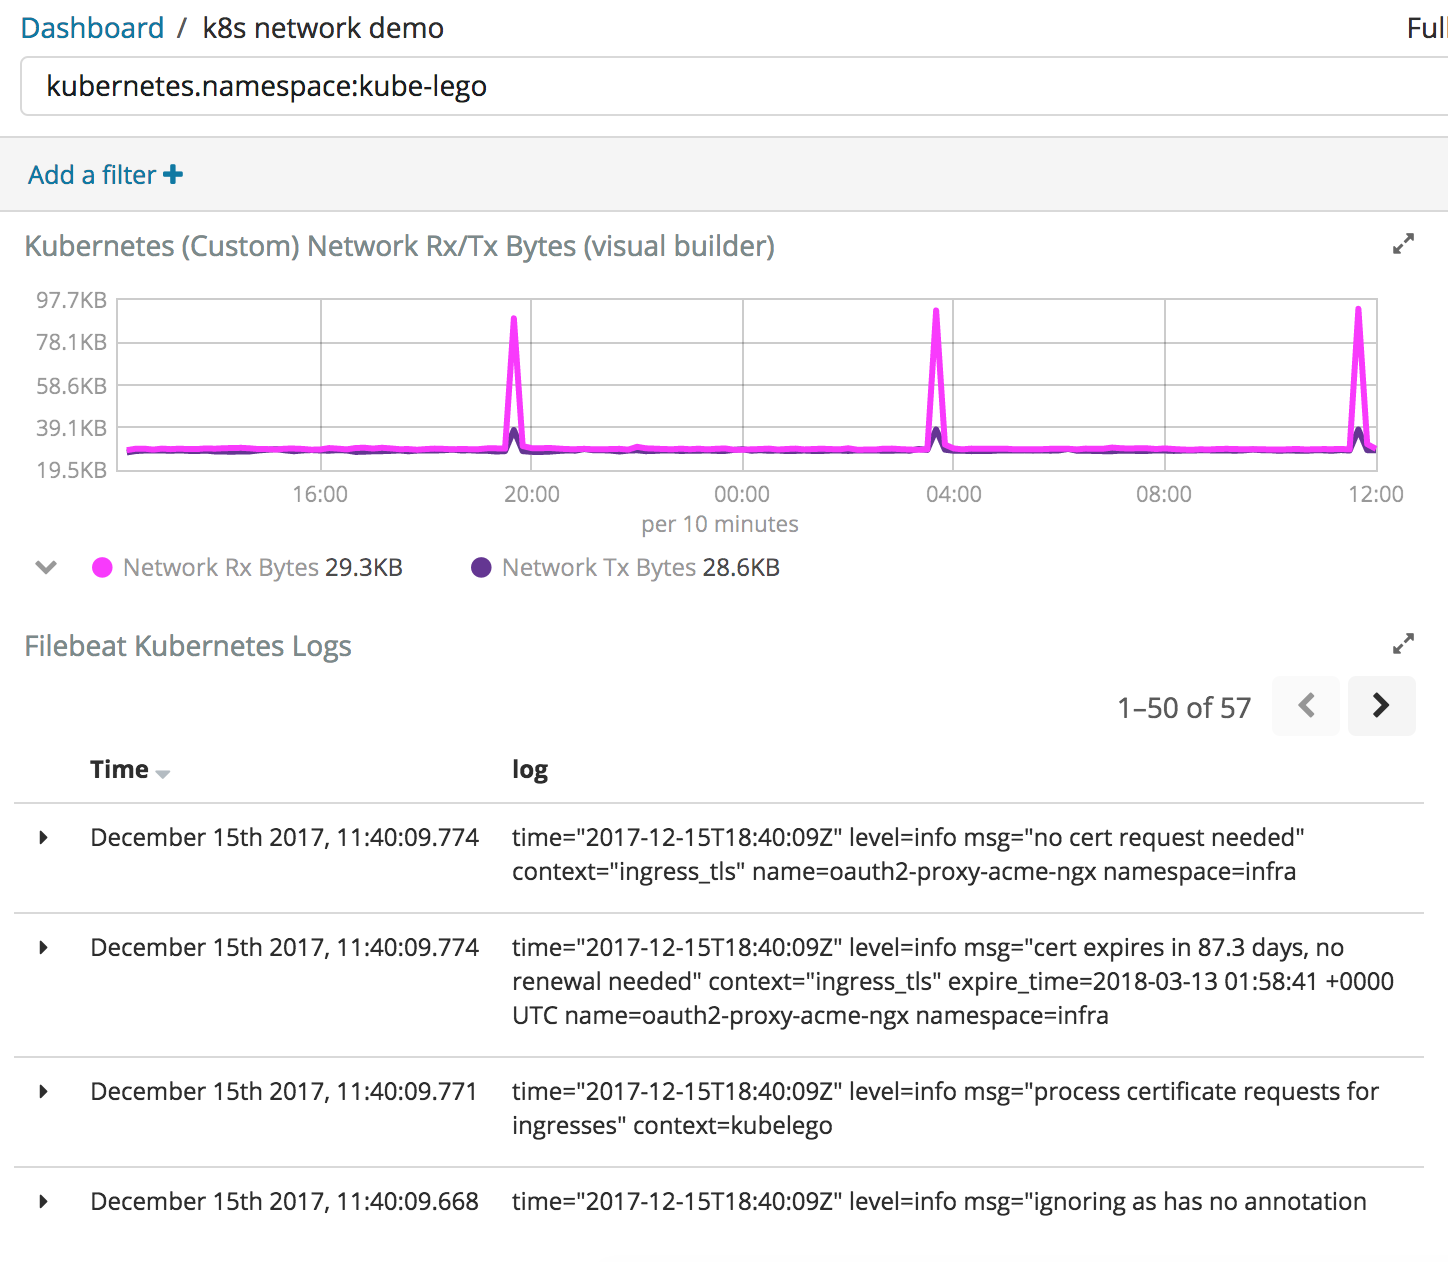
After noticing a spike in network activity or CPU consumption, you can easily narrow in on the time span in question and view logs that occurred at that moment in time to help delve deeper.
Summary
I hope this has shed some light on some reasons why adding the Elastic Stack to your Kubernetes deployment can be useful. As we continue to improve and expand the scope of data collection options available to Beats within Kubernetes, additional possibilities will continue to develop and make your cluster easier to monitor and manage.