Developers would like to see some log files from they applications

I created elk project(elasticsearch, logstash, kibana and filebeat) for production environment. It’s contained 1 server and 5 filebeat clients. Our developers would like to see some log files from they applications. I used system module, because is no other module close to they application. Kibana in logs view shows the paths to they log files, but no content. I checked syslog and auth.log files, same story. Only message, no content. Maybe Elasticsearch works like this? Can you clarify this, please? Or I have to change something?
Below, what I can see in LOG stream for one of my filebeat client:


My Index management:

So you have collected 475 million log entries. As a next step:

  1. Can you add one of your Filebeat configs?
  2. Are you getting the logs from your application? Probably the "awsapi02" search isn't what you want — what happens if you search for not event.dataset:system.log?

Hi Xeraa,

This my filebeat.yml file on awsapi02:

#=========================== Filebeat inputs =============================

filebeat.inputs:

Each - is an input. Most options can be set at the input level, so

you can use different inputs for various configurations.

Below are the input specific configurations.

  • type: log

Change to true to enable this input configuration.

enabled: true

Paths that should be crawled and fetched. Glob based paths.

paths:

paths:

/var/log/awsapi/localhost.log

/var/log/awsapi/server.log_yyyy-MM-ddTHH-mm-ss

#- c:\programdata\elasticsearch\logs*

Exclude lines. A list of regular expressions to match. It drops the lines that are

matching any regular expression from the list.

#exclude_lines: ['^DBG']

Include lines. A list of regular expressions to match. It exports the lines that are

matching any regular expression from the list.

#include_lines: ['^ERR', '^WARN']

#============================= Filebeat modules ===============================

filebeat.config.modules:

Glob pattern for configuration loading

path: ${path.config}/modules.d/*.yml

Set to true to enable config reloading

reload.enabled: false

Period on which files under path should be checked for changes

#reload.period: 10s

#==================== Elasticsearch template setting ==========================

setup.template.settings:

index.number_of_shards: 3

#index.codec: best_compression

#_source.enabled: false

#============================== Kibana =====================================

Starting with Beats version 6.0.0, the dashboards are loaded via the Kibana API.

This requires a Kibana endpoint configuration.

setup.kibana:

host: "10.70.53.201:5601"

Kibana Host

Scheme and port can be left out and will be set to the default (http and 5601)

In case you specify and additional path, the scheme is required: http://localhost:5601/path

IPv6 addresses should always be defined as: https://[2001:db8::1]:5601

#host: "localhost:5601"

Kibana Space ID

ID of the Kibana Space into which the dashboards should be loaded. By default,

the Default Space will be used.

#space.id:

#-------------------------- Elasticsearch output ------------------------------

output.elasticsearch:

Array of hosts to connect to.

hosts: ["10.70.53.201:9200"]

Protocol - either http (default) or https.

#protocol: "https"

Authentication credentials - either API key or username/password.

#api_key: "id:api_key"

#username: "elastic"

#password: "changeme"

Rest of the file is commented out.

When I tried to search for `not event.dataset:system.log, I got:```

``

It’s nothing what I am looking for.

image005.jpg

Please format your code for better readability.

The part with /var/log/awsapi/localhost.log looks good. Change the filter not in the highlights but in the KQL field (where it says awsapi02 in your screenshot — top left).

Which part of the code you want to see?

I change the filter in KQL field:

image005.jpg

Using properly formated code was just a general statement. The Filebeat config looked ok.

And the query should be not event.dataset:system.syslog, sorry. I want to exclude the syslog logs so we can see your own logs; though there will be multiple ways to do that. Alternatively filter on the log.file.path to the ones you're interested in.

When I tried to look for /var/log/awsapi/localhost.log, it shows message not content:

And for /var/log/awsapi/server.log_yyyy-MM-ddTHH-mm-ss, same story, just message:

image002.jpg

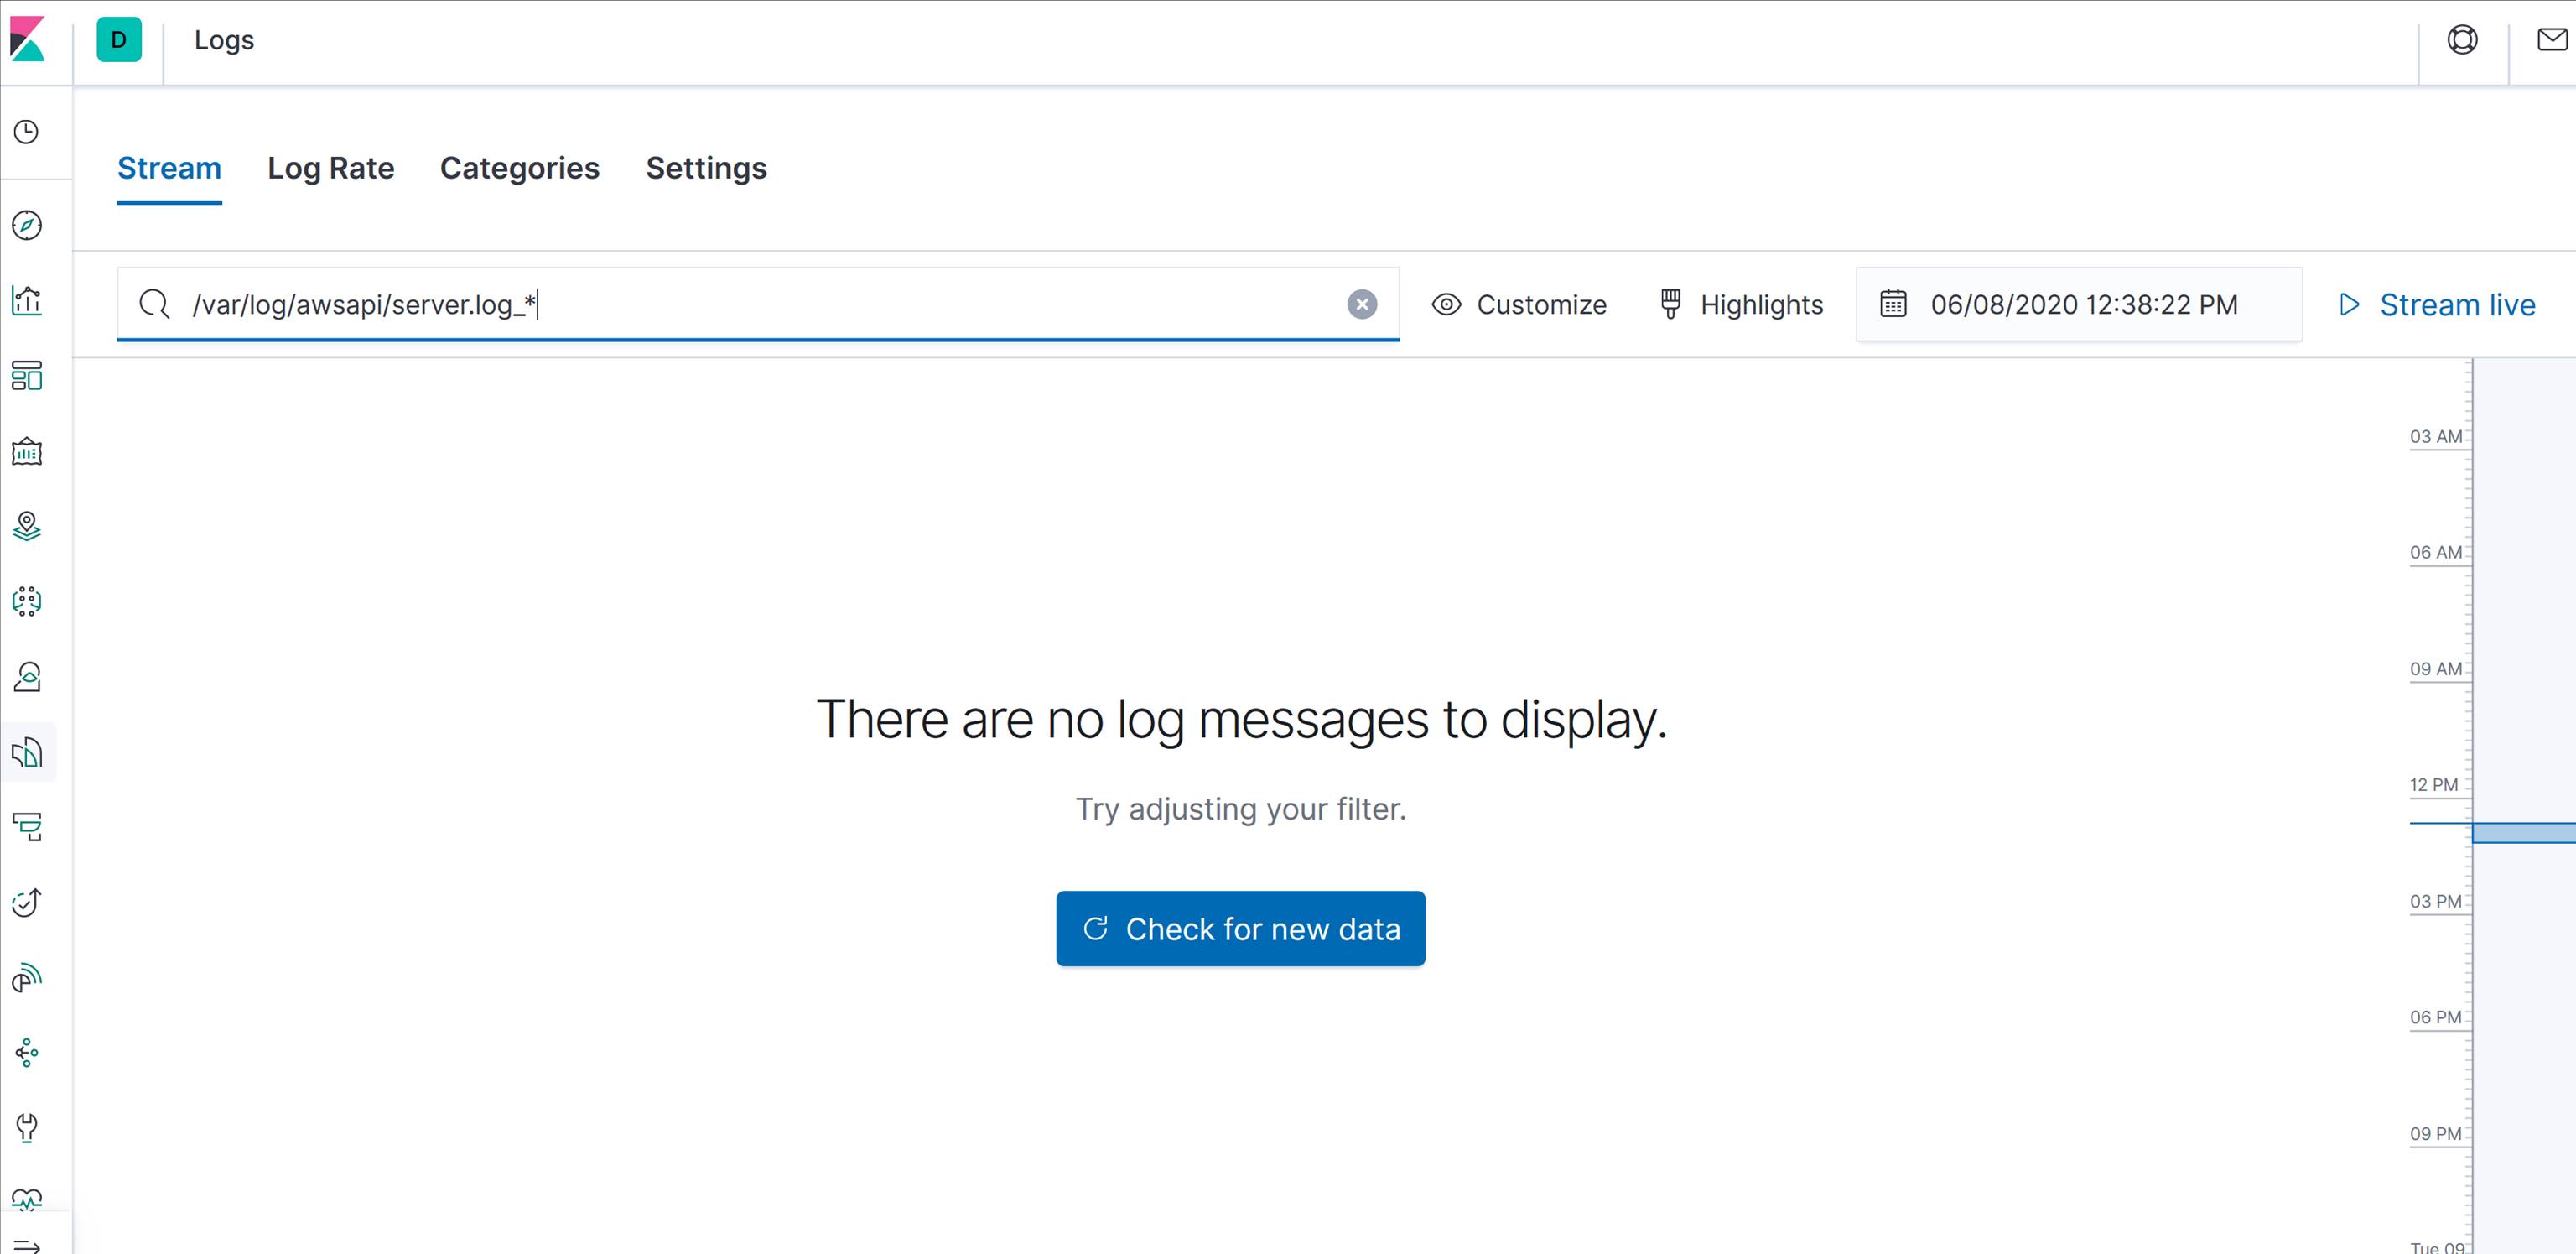
  1. I don't think /var/log/awsapi/server.log_yyyy-MM-ddTHH-mm-ss will do much, since this should be replaced by the actual timestamp. In your Filebeat config this should probably be /var/log/awsapi/server.log_*.
  2. Can you refresh the page and make sure your search is being applied? Because if there are no search hits, it should look like this:

  1. If I search for not log.file.path : "/var/log/syslog" it excludes those, but shows the results from other files.

I changed PATH in filebeat config file to `/var/log/awsapi/server.log_*. ``Restart filebeat service.```

`After this I executed: filebeat setup -e -E output.logstash.enabled=false -E output.elasticsearch.hosts=['10.70.53.201:9200'] -E setup.kibana.host=10.70.53.201:5601.```

`Refresh KDL field with /var/log/awsapi/server.log_yyyy_MM-ddTHH-mm-ss, same in Highlights and got:```

``

Without Highlights I got:

~WRD000.jpg

image005.jpg

This topic was automatically closed 28 days after the last reply. New replies are no longer allowed.