I'd really appreciate your help in the following. I am receiving JSON messages in Kibana and in them there is a key called warning. I'd like to create a simple visualisation (in tabular format?) that shows the timestamp of the message and the value of the key warning.
It sounds simple, but for the life of me, I still haven't found a way to do it. Any help?
Is this warning key something kibana sees as a field? If so, on Discover tab you can just mouse over that field and click the Add button that appears. That will cause your time-based data with that field to appear in a table (like response below).
Yes Kibana is seeing the warning key as a field and I have added it (as it shows on your screenshot). It appears fine in the "discover" part of Kibana, however, I am still unable to add it in a visualisation graph to be displayed as part of a data table so that it's easily seen as part of a dashboard.
Do you want to see the different values of the warning field over time?
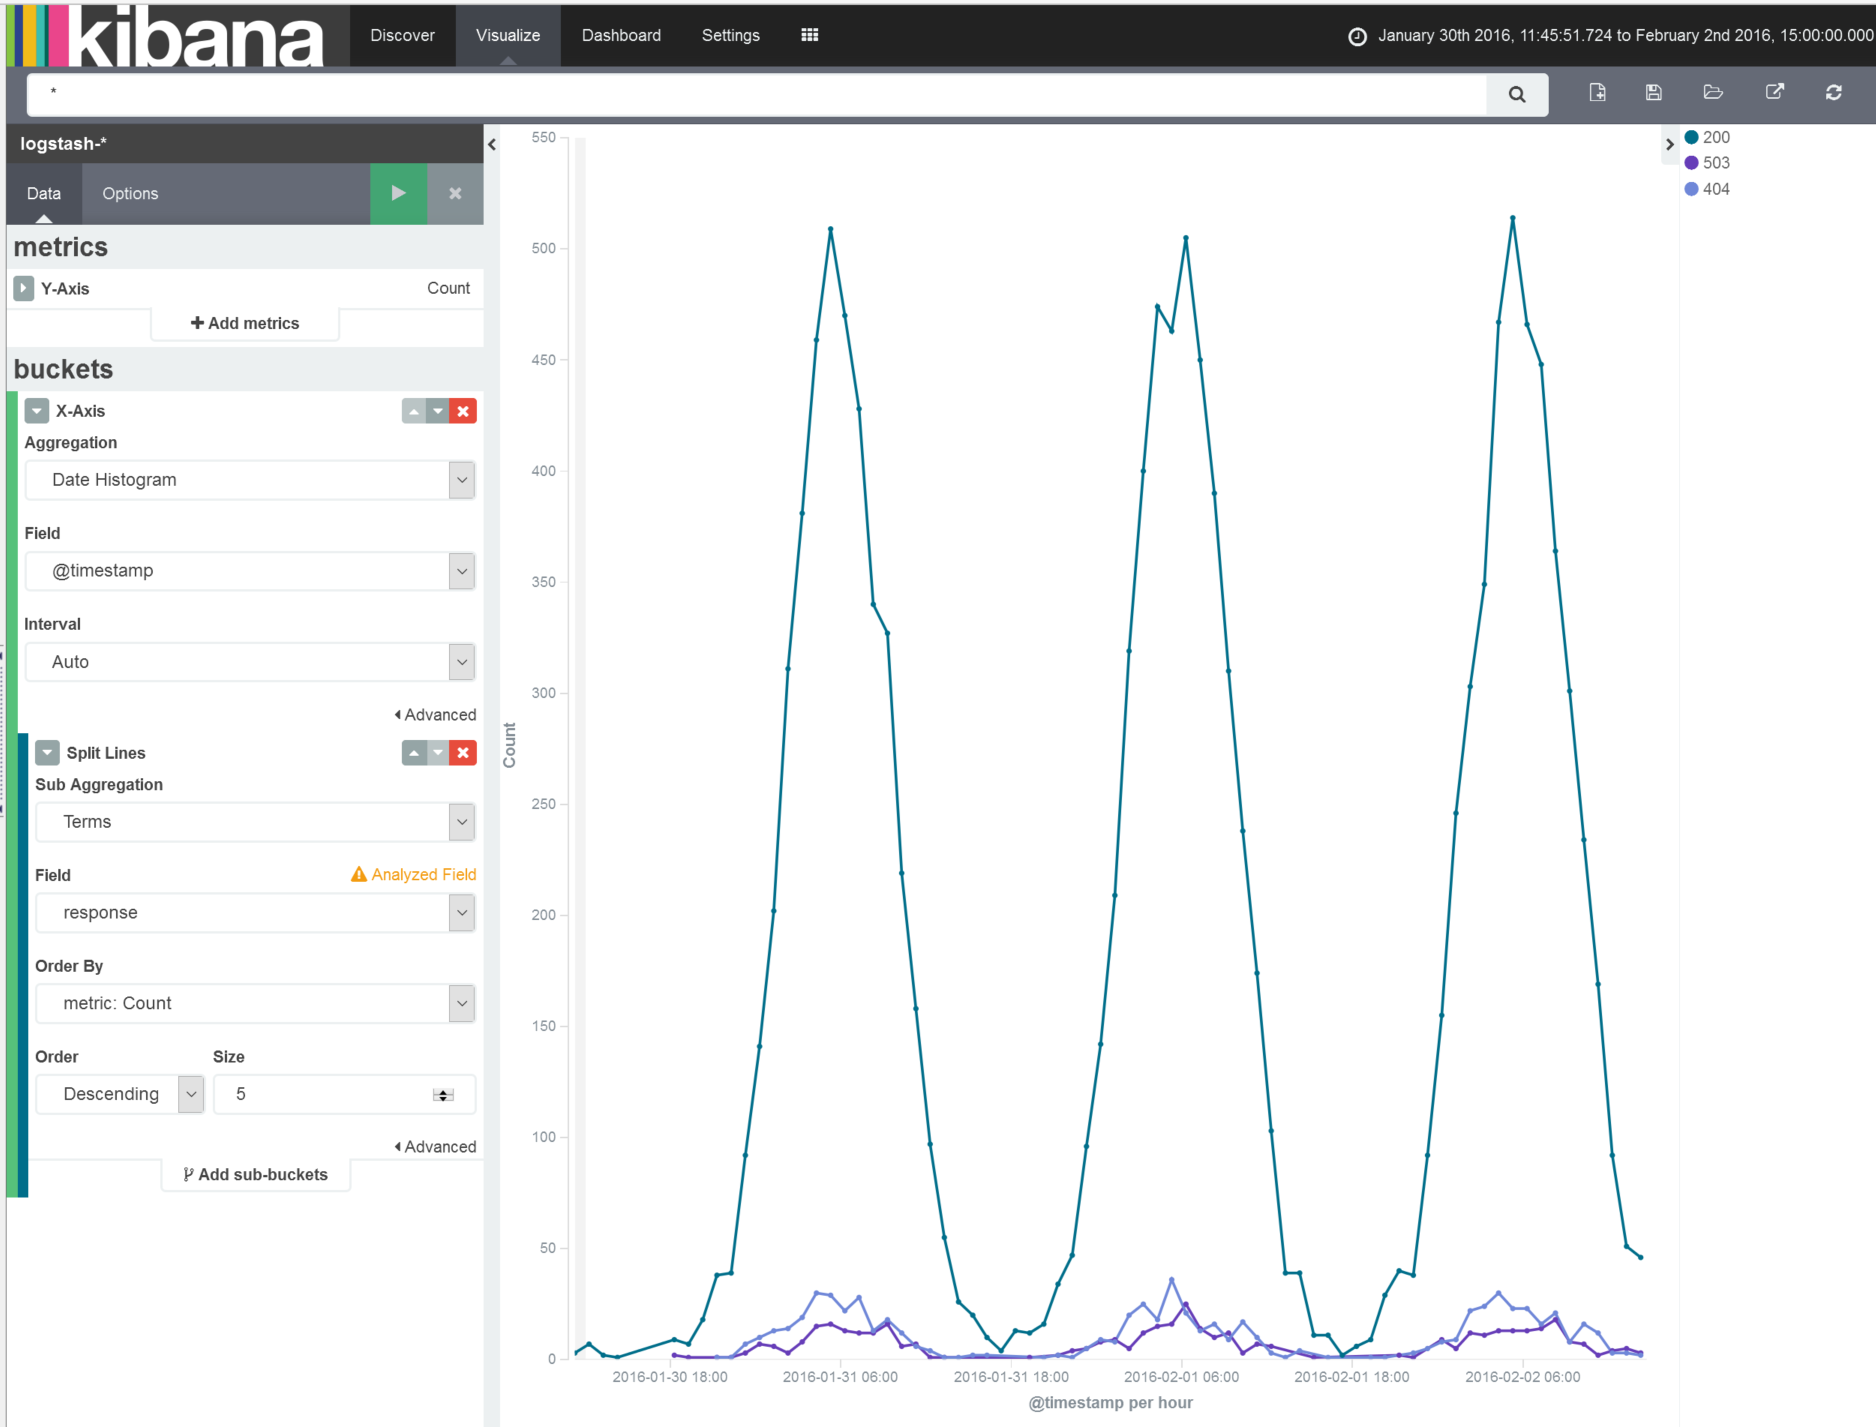
One way, is to create a Data Table visualization like I pasted below.
The metric aggregation is Count.
The first Split Rows is a Date Histogram.
The second Split Rows is Terms response (would be Warning for you).
This puts the different responses and counts within the 3 hour (Auto interval) buckets.
Thanks for your response once again. How do I use the data table to depict the warning if the warning consists of a sentence (strings), not numeric values, (e.g. "Door X is broken at building Z") ?
If I use your first suggestion I'd get in the responses column the words of the sentence broken down in different lines :-/
Note that the Discover tab doesn't show the raw fields, but if you are on the Visualize tab and select the Terms aggregation and then look in the Field selection list it may be there.
Or you might need to change your mapping to store the raw value for your warning.
Apache, Apache Lucene, Apache Hadoop, Hadoop, HDFS and the yellow elephant
logo are trademarks of the
Apache Software Foundation
in the United States and/or other countries.