Hi,
I have first index based on which filter control is created. It contains 1st field year-month and 2nd field contains date based on year-month selection.
I have created 2nd index that contains completely different data but also contains year-month & date field. Based on this 2nd index I have created DataTable.
Now I want to populate DataTable based on Month-Year & Date selection from the filter.
Is it possible?
Hello @RahulWagh,
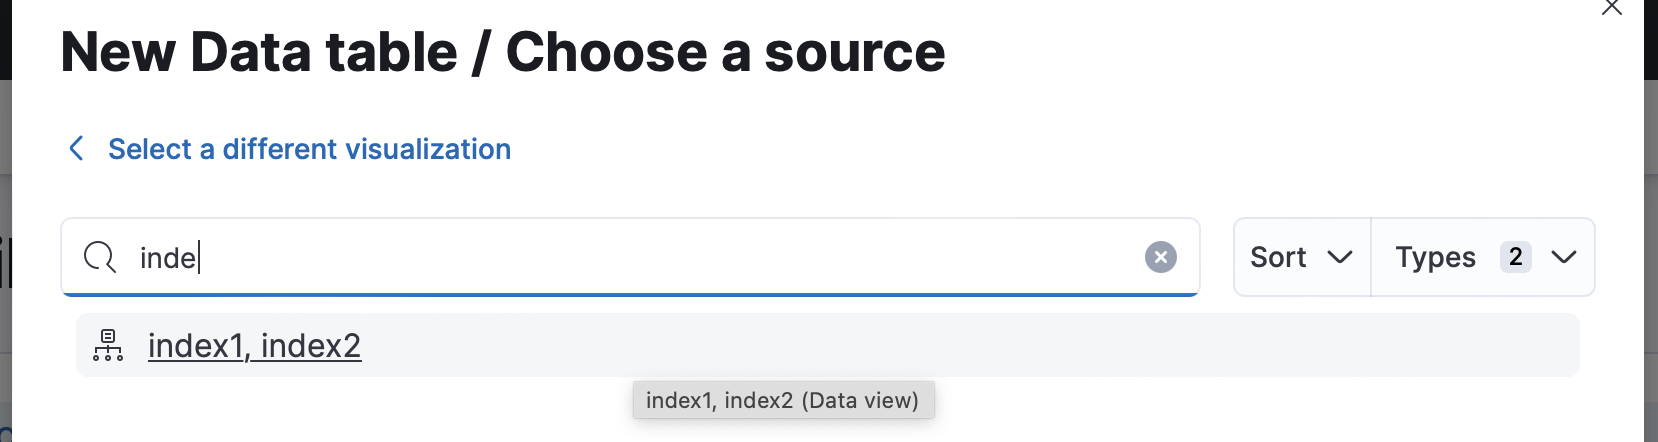
If I understand correctly, you want to create a Data Table visualization that considers data from two indices. You can do this by creating a data view pointing to your two indices: index1, index2.
Comma-separated.

And then create a Data Table visualization using this data view:
Hope it helps!