Hello all,
I am trying to understand the ideal timeout setting to be configured for data exports from Elastic.
Currently, the limit is set to 240 seconds, and is timing out when extracting 128,035 records from Elastic.
Based on the article below, I understand increasing the xpack.reporting.queue.timeout may help. Just wanted to check with this group if anyone knew an ideal timing limit
Kibana : Not able to generate large reports - Elastic Stack / Kibana - Discuss the Elastic Stack
Hi @harryDHL,
It looks like you are using the default. You could potentially set is slightly higher if you wish.
Rather than trying to guess an ideal time limit, can you give a rough indication of the export volume you are trying to extract? In some situations it may make more sense to use Logstash or scripting instead.
Let us know!
Hi Carly,
Thank you for your feedback. Can you please advise where I can check the volume of an export from Elastic?
Regards,
Harrison
Hello @harryDHL
Could you please share how you are trying to export the data from Elastic?
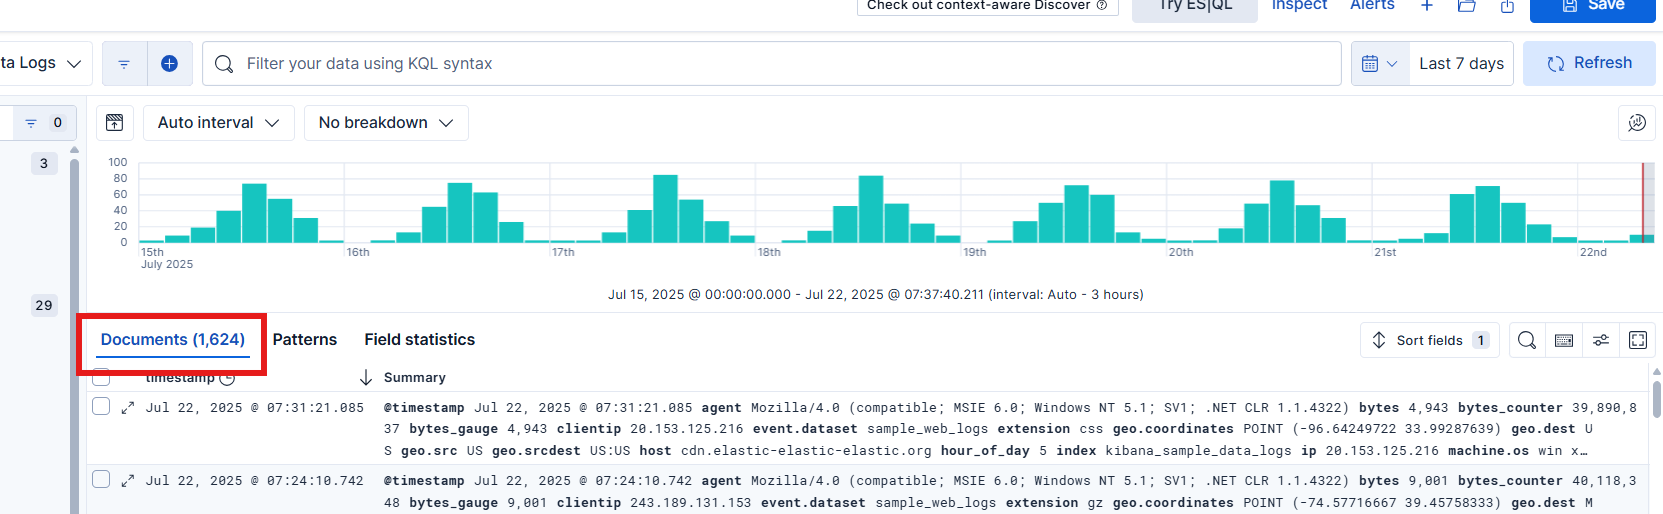
If you are doing from Kibana we can see the count of export as below :
If you want to do it via CURL :
GET _cat/indices?v&h=docs.count,pri,index
docs.count pri index
         0   1 .internal.alerts-transform.health.alerts-default-000001
         0   1 .internal.alerts-observability.logs.alerts-default-000001
         2   1 test
         0   1 .internal.alerts-observability.uptime.alerts-default-000001
     14074   1 .ds-kibana_sample_data_logs-2025.07.02-000001
         0   1 .internal.alerts-ml.anomaly-detection.alerts-default-000001
         0   1 .internal.alerts-observability.slo.alerts-default-000001
         0   1 .internal.alerts-default.alerts-default-000001
         0   1 .internal.alerts-observability.apm.alerts-default-000001
     13014   1 kibana_sample_data_flights
         0   1 metrics-endpoint.metadata_current_default
         0   1 .internal.alerts-observability.metrics.alerts-default-000001
         5   1 fruits
      4675   1 kibana_sample_data_ecommerce
         1   1 kibana_sample_automation
         0   1 .internal.alerts-ml.anomaly-detection-health.alerts-default-000001
         0   1 .internal.alerts-observability.threshold.alerts-default-000001
         0   1 .internal.alerts-security.alerts-default-000001
         0   1 .internal.alerts-stack.alerts-default-000001
curl -s localhost:9200/_stats -u elastic:password | jq '.indices | map_values(.primaries.docs.count) | add'
31771
curl -s -u elastic:password localhost:9200/_cat/indices?h=docs.count,pri | awk '{s+=$1} END {print s}'
31771
Maybe you can add the list of indices for which export is taken if it needs to be filter further.
Thanks!!