I have set up ES and Kibana as per Secure Elasticsearch with TLS encryption and role-based access control | Elastic Blog
I can hit /_cluster/health with both elastic and kibana users.
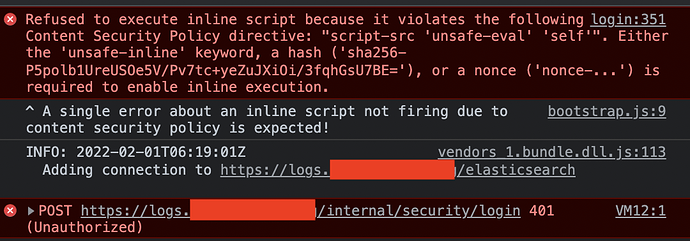
When I try and log in on the kibana UI, neither of those users work. I can't find anything in the logs other than:
This Kibana instance defines an older template version (6081699) than is currently in Elasticsearch (6082399). Because of the potential for non-backwards compatible changes, this Kibana instance will only be able to claim scheduled tasks with \"kibana.apiVersion\
I banged my head for a while trying to do something about that but from what I have read, it's not a major issue.
On the ES side, I can see that kibana is connecting to ES:
[2022-01-31T02:02:56,901][INFO ][o.e.c.m.MetaDataIndexTemplateService] [52.54.64.234] adding template [kibana_index_template:.kibana] for index patterns [.kibana]
[2022-01-31T02:02:56,919][INFO ][o.e.c.r.a.AllocationService] [52.54.64.234] Cluster health status changed from [YELLOW] to [GREEN] (reason: [shards started [[.kibana_1][0]] ...]).
[2022-01-31T02:02:59,780][INFO ][o.e.c.m.MetaDataIndexTemplateService] [52.54.64.234] adding template [kibana_index_template:.kibana] for index patterns [.kibana]
Elasticsearch.yml:
bootstrap.memory_lock: false
cluster.name: dev
discovery.zen.ping.unicast.hosts: elasticsearch-dev-1.node.consul,elasticsearch-dev-2.node.consul,elasticsearch-dev-3.node.consul
network.bind_host: 0.0.0.0
network.publish_host: 10.0.2.139
node.data: true
node.master: true
node.name: x.x.x.x

#################################### Paths ####################################

# Path to directory containing configuration (this file and logging.yml):

path.data: /var/lib/elasticsearch

path.logs: /var/log/elasticsearch

action.auto_create_index: true

xpack.security.enabled: true

xpack.security.transport.ssl.enabled: true
xpack.security.transport.ssl.verification_mode: "certificate"
xpack.security.transport.ssl.key: "/etc/elasticsearch/certs/internal_key.pem"
xpack.security.transport.ssl.certificate: "/etc/elasticsearch/certs/internal_cert.pem"
xpack.security.transport.ssl.certificate_authorities: "/etc/elasticsearch/certs/internal_ca.pem"
Kibana.yml:
server.port: 5601
server.host: "0.0.0.0"
elasticsearch.url: http://elasticsearch-dev-1.node.consul:9200
kibana.index: ".kibana"
elasticsearch.username: "kibana"
elasticsearch.password: "<password>"
Any idea why I can't log into kibana with credentials that are clearly valid?

