Hello Guys,
- Fresh install of ELK 8.x
- New index syslog-* created via logstash
Logstash config:
input {
  tcp {
    port => 5000
    type => syslog
    mode => "server"
    ssl_enable => true
    ssl_verify => false
    ssl_cert => "/etc/logstash/ssl/logstash.crt"
    ssl_key => "/etc/logstash/ssl/logstash.key"
  }
}

filter {
  if [type] == "syslog" {
    grok {
      match => { "message" => "%{SYSLOGTIMESTAMP:syslog_timestamp} %{SYSLOGHOST:syslog_hostname} %{DATA:syslog_program}(?:\[%{POSINT:syslog_pid}\])?: %{GREEDYDATA:syslog_message}" }
      add_field => [ "received_at", "%{@timestamp}" ]
      add_field => [ "ip", "%{[@metadata][input][tcp][source][ip]}" ]
    }
    date {
      match => [ "syslog_timestamp", "MMM  d HH:mm:ss", "MMM dd HH:mm:ss" ]
    }
  }
}

output {
  elasticsearch {
    hosts => ["https://localhost:9200"]
    user => "logstash_internal"
    password => "password"
    ssl => true
    ssl_certificate_verification => false
    index => "logs-%{+YYYY.MM.dd}"
  }
  file {
    path => "/log/%{+YYYY.MM.dd}/%{syslog_hostname}/%{syslog_hostname}-%{ip}.gzip"
    gzip => true
  }

}
Logstash user role:

Kibana rule creation issue:

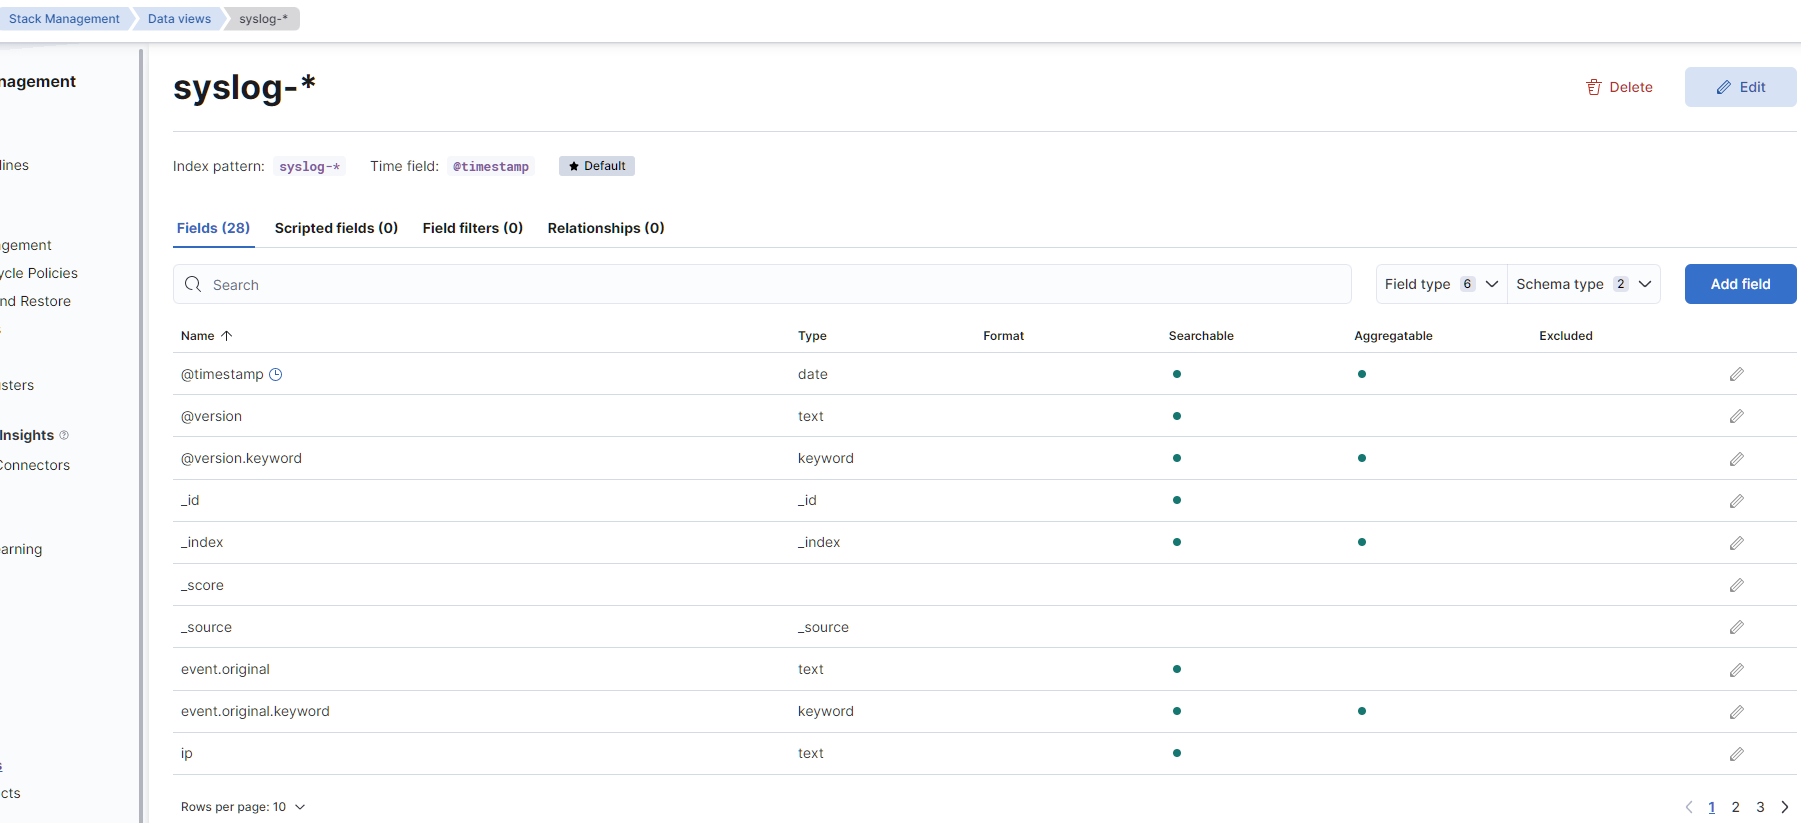
Data view:
- However when I setup Logstash output to default kibana "Data view" - logs-* then I'm able to create Alert Rule.
Am I missing something?
Please help!
