Hi all
I have a very simple stacked Graph. in Y-axis Have field "A" and on X-axis I have done a Terms aggregation with field B with unique count on Field "A". I have more fields say C, D, E(which are properties unique for Field A)
I have plotted a Stacked-Bar-Chart.
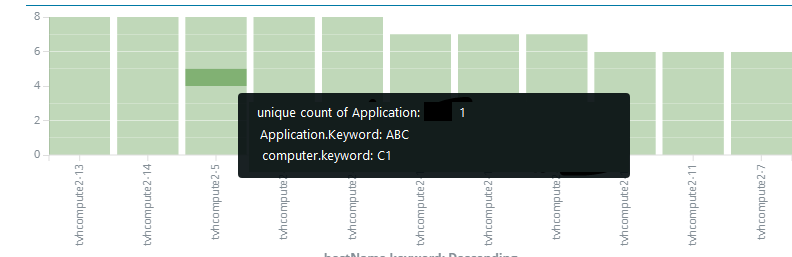
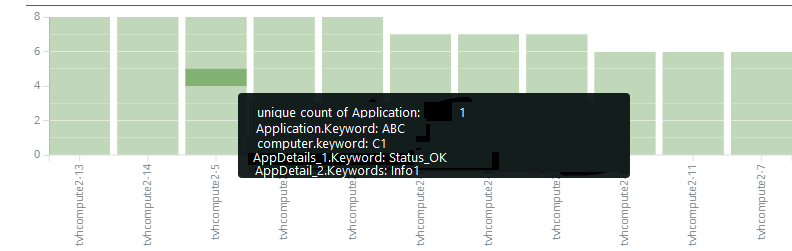
upon hovering on the graph I see that Field A and B. but i would like to see field C, D, E.
Hi there, could you share a screenshot of your visualization, including the editor sidebar, so I can better understand what you're trying to do? I'm not clear on what you mean by fields C, D, and E which are unique to field A. I also am not sure what you're seeing when you hover?
Apache, Apache Lucene, Apache Hadoop, Hadoop, HDFS and the yellow elephant
logo are trademarks of the
Apache Software Foundation
in the United States and/or other countries.