Error: fleet-server failed: context canceled | Error - dial tcp 172.18.0.2:9200: i/o timeout

Kibana version:
v 8.2.2
Elasticsearch version:
v 8.2.2
APM Server version:
v 8.2.2
APM Agent language and version:
Python 3.10.0
Browser version:
Google Chrome
Version 102.0.5005.63 (Official Build) (64-bit)

Original install method (e.g. download page, yum, deb, from source, etc.) and version:
Kibana and Elasticsearch are installed as docker containers

Fresh install or upgraded from other version?
Fresh install

Is there anything special in your setup?
No, I only followed the official documentation:

  1. Quick start | Elasticsearch Guide [8.2] | Elastic
  2. Add a Fleet Server | Fleet and Elastic Agent Guide [8.2] | Elastic
  3. Install Fleet-managed Elastic Agents | Fleet and Elastic Agent Guide [8.2] | Elastic
  4. Starlette/FastAPI Support | APM Python Agent Reference [6.x] | Elastic

Description of the problem including expected versus actual behavior. Please include screenshots (if relevant):

I'm trying to integrate my FastAPI server with ELK to be able to see server logs here http://localhost:5601/app/discover#/
I managed to find this instruction: Starlette/FastAPI Support | APM Python Agent Reference [6.x] | Elastic

But it never worked due to this error:

(venv) PS C:\PythonProjects\Fastapi> uvicorn mainfastapi:app --reload --port 80
INFO:     Will watch for changes in these directories: ['C:\\PythonProjects\\Fastapi']
INFO:     Uvicorn running on http://127.0.0.1:80 (Press CTRL+C to quit)
INFO:     Started reloader process [20476] using statreload
WARNING:  The --reload flag should not be used in production on Windows.
2022-06-06 00:30:38,906 - INFO - elastic_transport.transport - _transport:perform_request:336 - POST https://localhost:9200/my_index/_doc [status:201 duration:0.053s] # < -- as you can see I can send singe entries to ELK
2022-06-06 00:31:07,712 - WARNING - elasticapm.transport.http - http:fetch_server_info:202 - HTTP error while fetching server information: HTTPConnectionPool(host='localhost', port=8200): Max retries exceeded with url: / (Ca
used by NewConnectionError('<urllib3.connection.HTTPConnection object at 0x00000244F28797E0>: Failed to establish a new connection: [WinError 10061] No connection could be made because the target machine actively refused it'))

but generally it doesn't work, probably that's the first issue,

So I decided to try another solution: I installed Fleet on elastic and I'm trying to add an agent on my local machine, but I always end up with the following error:

and it seems
fleet agent can't connect to fleet server and I can't understand why...

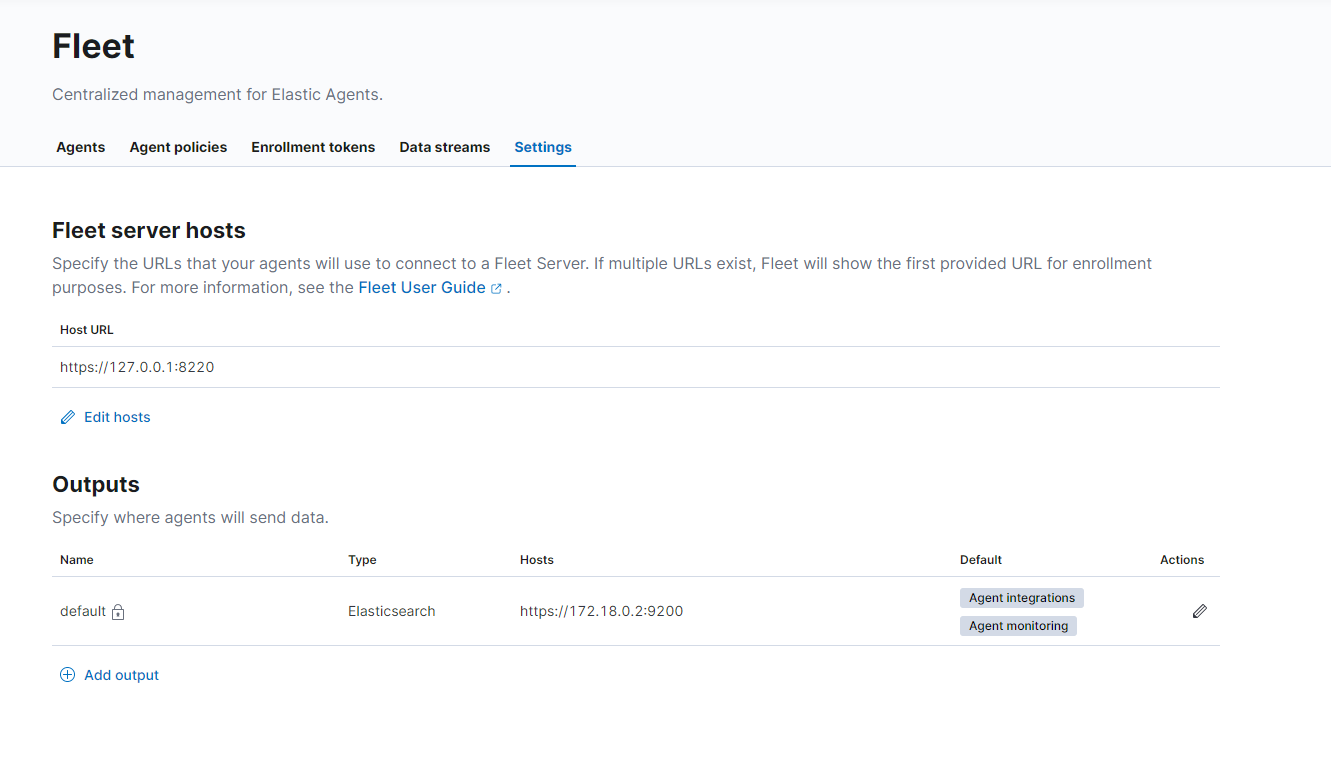
I have set the following settings on Server hosts page:

PS C:\Users\ilia1\Desktop\elastic-agent-8.2.2-windows-x86_64> .\elastic-agent.exe install  `
>>   --fleet-server-es=https://172.18.0.2:9200 `
>>   --fleet-server-service-token=token `
>>   --fleet-server-policy=fleet-server-policy `
>>   --fleet-server-es-ca-trusted-fingerprint=fingerprint
Elastic Agent will be installed at C:\Program Files\Elastic\Agent and will run as a service. Do you want to continue? [Y/n]:Y
{"log.level":"info","@timestamp":"2022-06-05T23:06:57.412+0300","log.origin":{"file.name":"cmd/enroll_cmd.go","file.line":393},"message":"Generating self-signed certificate for Fleet Server","ecs.version":"1.6.0"}
{"log.level":"info","@timestamp":"2022-06-05T23:06:59.699+0300","log.origin":{"file.name":"cmd/enroll_cmd.go","file.line":750},"message":"Waiting for Elastic Agent to start Fleet Server","ecs.version":"1.6.0"}
{"log.level":"info","@timestamp":"2022-06-05T23:07:29.734+0300","log.origin":{"file.name":"cmd/enroll_cmd.go","file.line":783},"message":"Fleet Server - Error - dial tcp 172.18.0.2:9200: i/o timeout","ecs.version":"1.6.0"}
{"log.level":"info","@timestamp":"2022-06-05T23:08:01.750+0300","log.origin":{"file.name":"cmd/enroll_cmd.go","file.line":783},"message":"Fleet Server - Starting","ecs.version":"1.6.0"}
Error: fleet-server failed: context canceled
For help, please see our troubleshooting guide at https://www.elastic.co/guide/en/fleet/8.2/fleet-troubleshooting.html
Error: enroll command failed with exit code: 1
For help, please see our troubleshooting guide at https://www.elastic.co/guide/en/fleet/8.2/fleet-troubleshooting.html

In Fleet agent logs:

{"log.level":"info","@timestamp":"2022-06-05T23:08:42.449+0300","log.origin":{"file.name":"log/reporter.go","file.line":40},"message":"2022-06-05T23:08:42+03:00 - message: Application: fleet-server--8.2.2[]: State changed to STARTING: Starting - type: 'STATE' - sub_type: 'STARTING'","ecs.version":"1.6.0"}
{"log.level":"error","@timestamp":"2022-06-05T23:08:52.680+0300","log.origin":{"file.name":"status/reporter.go","file.line":236},"message":"Elastic Agent status changed to: 'error'","ecs.version":"1.6.0"}
{"log.level":"error","@timestamp":"2022-06-05T23:08:52.680+0300","log.origin":{"file.name":"log/reporter.go","file.line":36},"message":"2022-06-05T23:08:52+03:00 - message: Application: fleet-server--8.2.2[]: State changed to FAILED: Error - dial tcp 172.18.0.2:9200: i/o timeout - type: 'ERROR' - sub_type: 'FAILED'","ecs.version":"1.6.0"}
{"log.level":"info","@timestamp":"2022-06-05T23:08:54.734+0300","log.origin":{"file.name":"status/reporter.go","file.line":236},"message":"Elastic Agent status changed to: 'online'","ecs.version":"1.6.0"}

Can you please help understand why I keep getting this error?

Can you post the docker commands you're using to start the individual containers?

Regarding being able to connect to localhost:9200 but not localhost:8200: I'm wondering if the elastic-agent container doesn't have this port exposed on the local machine.

Regarding agents not being able to connect to fleet-server:

PS C:\Users\ilia1\Desktop\elastic-agent-8.2.2-windows-x86_64> .\elastic-agent.exe install  `
>>   --fleet-server-es=https://172.18.0.2:9200 `
>>   --fleet-server-service-token=token `
>>   --fleet-server-policy=fleet-server-policy `
>>   --fleet-server-es-ca-trusted-fingerprint=fingerprint

It appears you're running elastic-agent on your local machine, but trying to connect to the elasticsearch via its docker network ip 172.18.0.2. I'm not familiar with windows, but on *nix machines these are separate from each other. You either need to run your containers in the same docker network, link your containers, or expose that container's port 9200 on the local machine and connect via the loopback address + port.

1 Like

Hi Stuart!
Thanks for getting into my issue.
I followed these command from the documentation:

for Elastic:

docker network create elastic
docker pull docker.elastic.co/elasticsearch/elasticsearch:8.2.2
docker run --name es01 --net elastic -p 9200:9200 -p 9300:9300 -it docker.elastic.co/elasticsearch/elasticsearch:8.2.2

and for Kibana:

docker pull docker.elastic.co/kibana/kibana:8.2.2
docker run --name kibana --net elastic -p 5601:5601 docker.elastic.co/kibana/kibana:8.2.2

So after that I have:

C:\Users\ilia1> docker ps -a
CONTAINER ID   IMAGE                                                 COMMAND                  CREATED        STATUS                      PORTS                                            NAMES
05833b8e71f9   docker.elastic.co/kibana/kibana:8.2.2                 "/bin/tini -- /usr/l…"   5 days ago     Exited (255) 32 hours ago   0.0.0.0:5601->5601/tcp                           kib-01
def740eb5293   docker.elastic.co/elasticsearch/elasticsearch:8.2.2   "/bin/tini -- /usr/l…"   5 days ago     Exited (255) 32 hours ago   0.0.0.0:9200->9200/tcp, 0.0.0.0:9300->9300/tcp   es-node01

Actually I'm using docker desktop app to start containers so I presume it should be just
something like this:

C:\Users\ilia1>docker container start kib-01
kib-01

C:\Users\ilia1>docker container start es-node01
es-node01

Also here are my docker network settings:

C:\Users\ilia1>docker network inspect elastic
[
    {
        "Name": "elastic",
        "Id": "324deb04bbcc55e4c76de46da399da2bda8a896ce767e6985212dac89459ceaa",
        "Created": "2022-06-02T10:48:56.0936205Z",
        "Scope": "local",
        "Driver": "bridge",
        "EnableIPv6": false,
        "IPAM": {
            "Driver": "default",
            "Options": {},
            "Config": [
                {
                    "Subnet": "172.18.0.0/16",
                    "Gateway": "172.18.0.1"
                }
            ]
        },
        "Internal": false,
        "Attachable": false,
        "Ingress": false,
        "ConfigFrom": {
            "Network": ""
        },
        "ConfigOnly": false,
        "Containers": {},
        "Options": {},
        "Labels": {}
    }
]

Weird that after launching containers I'm able to
open https://localhost:9200/ from my browser:
image

I also presume that the solution for me would be something simple, but I don't know where to dig...

I clearly see that fleet agent can't connect to the fleet server in docker container on (172.18.0.2:9200) according to the error:

Error - dial tcp 172.18.0.2:9200: i/o timeout

So:

  1. Am I correct that the fleet server (added on elk in container through fleet integration) and a fleet agent are everything I need?

  2. Shouldn't I additionally install fleet server and somehow additionally configure it to my current setup, should I?

If not could you please let me know is there an article somewhere on elastic showing how to tweak the standard docker network I created, so that I can connect my local fleet-agent with an elk fleet-server on the docker container?

Highly appreciate any suggestions!

Still relevant, please help.

Just update your enrolment command so that the fleet-server-es value is pointing to localhost (127.0.0.1) and that should sort it out :wink:
e.g.

PS C:\Users\ilia1\Desktop\elastic-agent-8.2.2-windows-x86_64> .\elastic-agent.exe install  `
>>   --fleet-server-es=https://127.0.0.1:9200 `
>>   --fleet-server-service-token=token `
>>   --fleet-server-policy=fleet-server-policy `
>>   --fleet-server-es-ca-trusted-fingerprint=fingerprint
1 Like

thanks, your suggestion helped me to finish enrolment,
So Now I have kibana and elk running on docker containers, and an enrolled agent on my windows computer,
(I can see Elastic Agent service running:

)

But it still doesn't send any logs to kibana - when I press "continue" nothing happens.
If close this window and go to Fleet integration -> agents tab, I'll see a healthy agent:

but when I click on this agent (under Host column) there is no logs on my agent's dashboard:

Am really confused... can you please help me to understand why is this happening?

This topic was automatically closed 20 days after the last reply. New replies are no longer allowed.