Fields are not being parsed in new version of kibna

Hi

fileds such as ApplicationPool , ConnectedServerPort , bytesReceivedFromClient , httpResponse , uriPathWithParam etc are not being segregated, in kibana, due to which we are unable to perform visualizations, based on the above fields.

i have been able to do the same in the older version of kibana as attached

Please can some one guide me

Thanks

If screenshot 1 is from latest version of Kibana, I dont even see the said fields in table. Please check that log message getting parsed or not.
Please paste entire json tab data. And if possible do a comparison between Old and New Kibana JSON data

old version Json Data

{
"_index": "logstash-2018.04.05",
"_type": "ZXTMLogs",
"_id": "AWKUwjnmHZOn2S2gqLu0",
"_score": 1,
"_source": {
"clientIpAddress": "10.187.146.191",
"totalTimeTakenForClient": 0.044582,
"requestTimestamp": "05/Apr/2018:08:41:03 +0100",
"timeTakenToConstructResponse": 0.044582,
"httpmethod": "POST",
"message": "0.044582 10.187.146.191 [05/Apr/2018:08:41:03 +0100] VS_UKBDR_Portal,MGD&Filerepository_10.187.174.33_80 - "urn:BT.MGD.Runtime.API.IMGDService/IMGDService/GetNext" POST /Service.svc 200 1131 1200 0.044582 10.187.133.0:61057 PL_UKBDR_MGDService_61057 -",
"type": "ZXTMLogs",
"VirtualServer": "VS_UKBDR_Portal,MGD&Filerepository_10.187.174.33_80",
"path": "F:/UKBlogsstachconfiguration/Logstobestached/ZTMLogpath/05_Apr_2018_08_41_DR.log",
"ConnectedServerPort": "61057",
"@timestamp": "2018-04-05T07:42:59.480Z",
"ApplicationPool": "PL_UKBDR_MGDService_61057",
"bytesReceivedFromClient": 1131,
"@version": "1",
"host": "BWD10427003",
"bytesSentToClient": 1200,
"uriPathWithParam": "/Service.svc",
"httpResponse": 200,
"SoapAction": ""urn:BT.MGD.Runtime.API.IMGDService/IMGDService/GetNext"",
"Connected_Server": "10.187.133.0"
},
"fields": {
"@timestamp": [
1522914179480
]
}
}

new version

{
"_index": "logstash-2018.04.05",
"_type": "doc",
"_id": "o7u7lGIB_8p3Tx4A4ddl",
"_score": 1,
"_source": {
"offset": 370390,
"@timestamp": "2018-04-05T07:36:03.197Z",
"source": "/software/stm/zxtm/log/VS_UKB_Supportapp.log",
"prospector": {
"type": "log"
},
"message": "1.072272 147.151.218.102 [05/Apr/2018:08:35:56 +0100] VS_UKB_Supportapp - - GET /Download.aspx?downloadType=ChatLog&fromDate=04-04-2018&toDate=04-04-2018 200 2025 145259 1.068775 10.54.33.104:61016 PL_Supportchat 10.54.33.104:61016",
"tags": [
"beats_input_codec_plain_applied"
],
"@version": "1",
"beat": {
"hostname": "blp10427011",
"name": "blp10427011",
"version": "6.2.3"
},
"host": "blp10427011"
},
"fields": {
"@timestamp": [
"2018-04-05T07:36:03.197Z"
]
}
}

and i am using the same logstash config in both the cases

I am not sure whats happening. But, your logstash grok is unable to parse your message. Thats the reason in your latest Kibana json you dont see any of those fields. and as thr fields are not available your Kibana analytics is failing.

It doesn't look like any grok filter is applied. If it was failing I would expect to see a grok parse failure tag on the document. Have you changed your Logstash config?

can i know where i can see grok failure logs?

You should be able to see a tag on the document indicating that it failed. The only tag you have is beats_input_codec_plain_applied, which is why I suspect grok may not have been applied at all.

If you look at the structure of the documents, it does not contain the fields typically added by filebeat, so it is possible this was collected and processed directly by Logstash. The new record does however seem to have been collected by Filebeat as additional fields are available here. If Filebeat was configured to write directly to Elasticsearch instead of sending data through Logstash, that might explain why no grok processing has taken place.

ok so will try to redirect to elastic search and try

hi can you suggest how can i debug grok ?

Is the data going through Logstash? It looks like Filebeat might be sending it directly to Elasticsearch, bypassing the grok processing in Logstash.

Please paste us your Logstash and Filebeat config. Also pleae add stdout{codec=>rubydebug} tou your output.

Also as Chris said, it might be directly sending to ES intance. Please verify

file beat config as below

#=========================== Filebeat prospectors =============================

filebeat.prospectors:

Each - is a prospector. Most options can be set at the prospector level, so

you can use different prospectors for various configurations.

Below are the prospector specific configurations.

  • type: log

    Change to true to enable this prospector configuration.

    enabled: true

    Paths that should be crawled and fetched. Glob based paths.

    paths:

    • /software/stm/zxtm/log/*.log
      #- c:\programdata\elasticsearch\logs*

#================================ Outputs =====================================

Configure what output to use when sending the data collected by the beat.

#-------------------------- Elasticsearch output ------------------------------
##output.elasticsearch:

Array of hosts to connect to

hosts: ["10.52.33.97:63354"]

Optional protocol and basic auth credentials.

#protocol: "https"
#username: "elastic"
#password: "changeme"

#----------------------------- Logstash output --------------------------------
output.logstash:

The Logstash hosts

hosts: ["10.52.33.97:63354"]

Optional SSL. By default is off.

List of root certificates for HTTPS server verifications

#ssl.certificate_authorities: ["/etc/pki/root/ca.pem"]

Certificate for SSL client authentication

#ssl.certificate: "/etc/pki/client/cert.pem"

Client Certificate Key

#ssl.key: "/etc/pki/client/cert.key"

Your filebeat is direclty posting to Elasticsearch. It should be logstash if you want to parse your message.
And I see your logstash host and elastic host and port numbers are same. Please check that also!

oh may be i forgot to comment elastic search hosts, will that work if i comment the whole section of elastic search or remove ot completely

It should work, given that you are giving proper logstash host details.

###################### Filebeat Configuration Example #########################

This file is an example configuration file highlighting only the most common

options. The filebeat.reference.yml file from the same directory contains all the

supported options with more comments. You can use it as a reference.

You can find the full configuration reference here:

https://www.elastic.co/guide/en/beats/filebeat/index.html

For more available modules and options, please see the filebeat.reference.yml sample

configuration file.

#=========================== Filebeat prospectors =============================

filebeat.prospectors:

Each - is a prospector. Most options can be set at the prospector level, so

you can use different prospectors for various configurations.

Below are the prospector specific configurations.

  • type: log

    Change to true to enable this prospector configuration.

    enabled: false

    Paths that should be crawled and fetched. Glob based paths.

    paths:

    • /software/stm/zxtm/log/*.log
      #- c:\programdata\elasticsearch\logs*

    Exclude lines. A list of regular expressions to match. It drops the lines that are

    matching any regular expression from the list.

    #exclude_lines: ['^DBG']

    Include lines. A list of regular expressions to match. It exports the lines that are

    matching any regular expression from the list.

    #include_lines: ['^ERR', '^WARN']

    Exclude files. A list of regular expressions to match. Filebeat drops the files that

    are matching any regular expression from the list. By default, no files are dropped.

    #exclude_files: ['.gz$']

    Optional additional fields. These fields can be freely picked

    to add additional information to the crawled log files for filtering

    #fields:

    level: debug

    review: 1

    Multiline options

    Mutiline can be used for log messages spanning multiple lines. This is common

    for Java Stack Traces or C-Line Continuation

    The regexp Pattern that has to be matched. The example pattern matches all lines starting with [

    #multiline.pattern: ^[

    Defines if the pattern set under pattern should be negated or not. Default is false.

    #multiline.negate: false

    Match can be set to "after" or "before". It is used to define if lines should be append to a pattern

    that was (not) matched before or after or as long as a pattern is not matched based on negate.

    Note: After is the equivalent to previous and before is the equivalent to to next in Logstash

    #multiline.match: after

#============================= Filebeat modules ===============================

filebeat.config.modules:

Glob pattern for configuration loading

path: ${path.config}/modules.d/*.yml

Set to true to enable config reloading

reload.enabled: false

Period on which files under path should be checked for changes

#reload.period: 10s

#==================== Elasticsearch template setting ==========================

setup.template.settings:
index.number_of_shards: 3
#index.codec: best_compression
#_source.enabled: false

#================================ General =====================================

The name of the shipper that publishes the network data. It can be used to group

all the transactions sent by a single shipper in the web interface.

#name:

The tags of the shipper are included in their own field with each

transaction published.

#tags: ["service-X", "web-tier"]

Optional fields that you can specify to add additional information to the

output.

#fields:

env: staging

#============================== Dashboards =====================================

These settings control loading the sample dashboards to the Kibana index. Loading

the dashboards is disabled by default and can be enabled either by setting the

options here, or by using the -setup CLI flag or the setup command.

#setup.dashboards.enabled: false

The URL from where to download the dashboards archive. By default this URL

has a value which is computed based on the Beat name and version. For released

versions, this URL points to the dashboard archive on the artifacts.elastic.co

website.

#setup.dashboards.url:

#============================== Kibana =====================================

Starting with Beats version 6.0.0, the dashboards are loaded via the Kibana API.

This requires a Kibana endpoint configuration.

setup.kibana:

Kibana Host

Scheme and port can be left out and will be set to the default (http and 5601)

In case you specify and additional path, the scheme is required: http://localhost:5601/path

IPv6 addresses should always be defined as: https://[2001:db8::1]:5601

#host: "localhost:5601"

#============================= Elastic Cloud ==================================

These settings simplify using filebeat with the Elastic Cloud (https://cloud.elastic.co/).

The cloud.id setting overwrites the output.elasticsearch.hosts and

setup.kibana.host options.

You can find the cloud.id in the Elastic Cloud web UI.

#cloud.id:

The cloud.auth setting overwrites the output.elasticsearch.username and

output.elasticsearch.password settings. The format is <user>:<pass>.

#cloud.auth:

#================================ Outputs =====================================

Configure what output to use when sending the data collected by the beat.

#-------------------------- Elasticsearch output ------------------------------
#output.elasticsearch:

Array of hosts to connect to.

#hosts: ["localhost:9200"]

Optional protocol and basic auth credentials.

#protocol: "https"
#username: "elastic"
#password: "changeme"

#----------------------------- Logstash output --------------------------------
output.logstash:

The Logstash hosts

hosts: ["10.52.33.97:63354"]

Optional SSL. By default is off.

List of root certificates for HTTPS server verifications

#ssl.certificate_authorities: ["/etc/pki/root/ca.pem"]

Certificate for SSL client authentication

#ssl.certificate: "/etc/pki/client/cert.pem"

Client Certificate Key

#ssl.key: "/etc/pki/client/cert.key"

#================================ Logging =====================================

Sets log level. The default log level is info.

Available log levels are: critical, error, warning, info, debug

#logging.level: debug

At debug level, you can selectively enable logging only for some components.

To enable all selectors use ["*"]. Examples of other selectors are "beat",

"publish", "service".

#logging.selectors: ["*"]

i am not trying to put this beaqtconfic, please can you verify if its fine or any corrections required.

i am now trying to put this beat config, please can you verify if its fine or any corrections required.

Looks good to me, check that Logstash input is pointed to this port 63354

yea log stash id listening to beats at 63354, thanks for checking, will update once i am able to apply it

i later corrected and finalised beatconfig as below

###################### Filebeat Configuration Example #########################

# This file is an example configuration file highlighting only the most common
# options. The filebeat.reference.yml file from the same directory contains all the
# supported options with more comments. You can use it as a reference.
#
# You can find the full configuration reference here:
# https://www.elastic.co/guide/en/beats/filebeat/index.html

# For more available modules and options, please see the filebeat.reference.yml sample
# configuration file.

#=========================== Filebeat prospectors =============================

filebeat.prospectors:

Each - is a prospector. Most options can be set at the prospector level, so

you can use different prospectors for various configurations.

Below are the prospector specific configurations.

  • type: log

    Change to true to enable this prospector configuration.

    enabled: true

    Paths that should be crawled and fetched. Glob based paths.

    paths:

    • /software/stm/zxtm/log/*.log
      #- c:\programdata\elasticsearch\logs*

    Exclude lines. A list of regular expressions to match. It drops the lines that are

    matching any regular expression from the list.

    #exclude_lines: ['^DBG']

    Include lines. A list of regular expressions to match. It exports the lines that are

    matching any regular expression from the list.

    #include_lines: ['^ERR', '^WARN']

    Exclude files. A list of regular expressions to match. Filebeat drops the files that

    are matching any regular expression from the list. By default, no files are dropped.

    #exclude_files: ['.gz$']

    Optional additional fields. These fields can be freely picked

    to add additional information to the crawled log files for filtering

    #fields:

    level: debug

    review: 1

    Multiline options

    Mutiline can be used for log messages spanning multiple lines. This is common

    for Java Stack Traces or C-Line Continuation

    The regexp Pattern that has to be matched. The example pattern matches all lines starting with [

    #multiline.pattern: ^[

    Defines if the pattern set under pattern should be negated or not. Default is false.

    #multiline.negate: false

    Match can be set to "after" or "before". It is used to define if lines should be append to a pattern

    that was (not) matched before or after or as long as a pattern is not matched based on negate.

    Note: After is the equivalent to previous and before is the equivalent to to next in Logstash

    #multiline.match: after

#============================= Filebeat modules ===============================

#filebeat.config.modules:

Glob pattern for configuration loading

#path: ${path.config}/modules.d/*.yml

Set to true to enable config reloading

#reload.enabled: false

Period on which files under path should be checked for changes

#reload.period: 10s

#==================== Elasticsearch template setting ==========================

setup.template.settings:

#index.number_of_shards: 3
#index.codec: best_compression
#_source.enabled: false

#================================ General =====================================

The name of the shipper that publishes the network data. It can be used to group

all the transactions sent by a single shipper in the web interface.

#name:

The tags of the shipper are included in their own field with each

transaction published.

#tags: ["service-X", "web-tier"]

Optional fields that you can specify to add additional information to the

output.

#fields:

env: staging

#============================== Dashboards =====================================

These settings control loading the sample dashboards to the Kibana index. Loading

the dashboards is disabled by default and can be enabled either by setting the

options here, or by using the -setup CLI flag or the setup command.

#setup.dashboards.enabled: false

The URL from where to download the dashboards archive. By default this URL

has a value which is computed based on the Beat name and version. For released

versions, this URL points to the dashboard archive on the artifacts.elastic.co

website.

#setup.dashboards.url:

#============================== Kibana =====================================

Starting with Beats version 6.0.0, the dashboards are loaded via the Kibana API.

This requires a Kibana endpoint configuration.

#setup.kibana:

Kibana Host

Scheme and port can be left out and will be set to the default (http and 5601)

In case you specify and additional path, the scheme is required: http://localhost:5601/path

IPv6 addresses should always be defined as: https://[2001:db8::1]:5601

#host: "localhost:5601"

#============================= Elastic Cloud ==================================

These settings simplify using filebeat with the Elastic Cloud (https://cloud.elastic.co/).

The cloud.id setting overwrites the output.elasticsearch.hosts and

setup.kibana.host options.

You can find the cloud.id in the Elastic Cloud web UI.

#cloud.id:

The cloud.auth setting overwrites the output.elasticsearch.username and

output.elasticsearch.password settings. The format is <user>:<pass>.

#cloud.auth:

#================================ Outputs =====================================

Configure what output to use when sending the data collected by the beat.

#-------------------------- Elasticsearch output ------------------------------
#output.elasticsearch:

Array of hosts to connect to.

#hosts: ["localhost:9200"]

Optional protocol and basic auth credentials.

#protocol: "https"
#username: "elastic"
#password: "changeme"

#----------------------------- Logstash output --------------------------------
output.logstash:

The Logstash hosts

hosts: ["10.52.33.97:63354"]

Optional SSL. By default is off.

List of root certificates for HTTPS server verifications

#ssl.certificate_authorities: ["/etc/pki/root/ca.pem"]

Certificate for SSL client authentication

#ssl.certificate: "/etc/pki/client/cert.pem"

Client Certificate Key

#ssl.key: "/etc/pki/client/cert.key"

#================================ Logging =====================================

Sets log level. The default log level is info.

Available log levels are: critical, error, warning, info, debug

#logging.level: debug

At debug level, you can selectively enable logging only for some components.

To enable all selectors use ["*"]. Examples of other selectors are "beat",

"publish", "service".

#logging.selectors: ["*"]


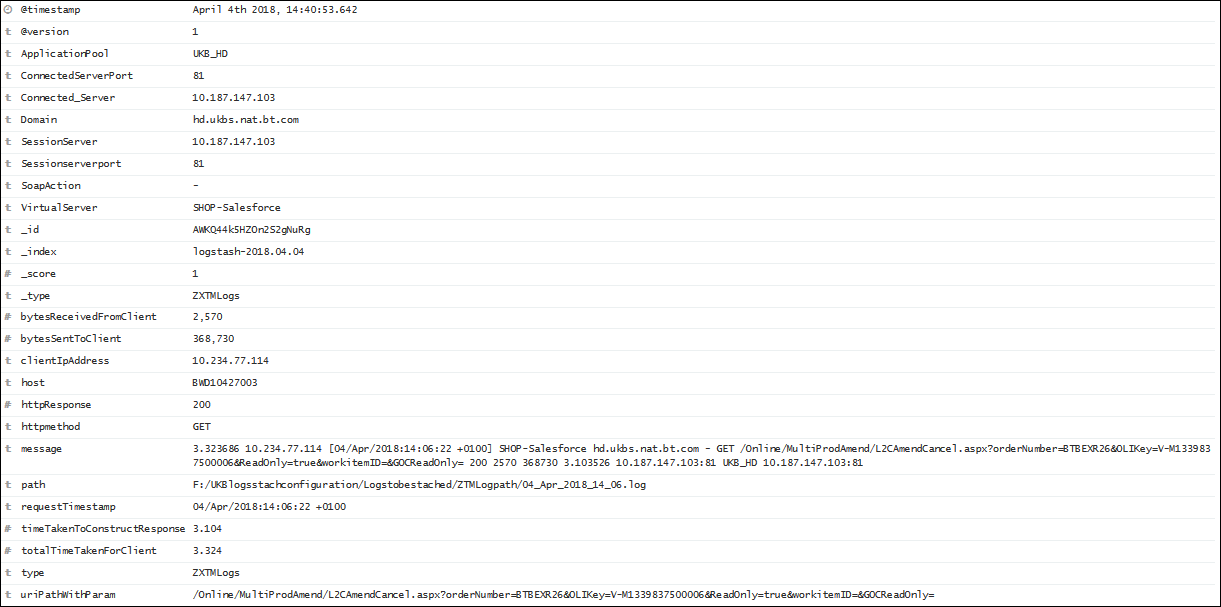
now the data is back on kibana, but still its not getting parsed as per my expectation