Filter results in a visualization using JSON (filter for a "greater than" result)

Hi,
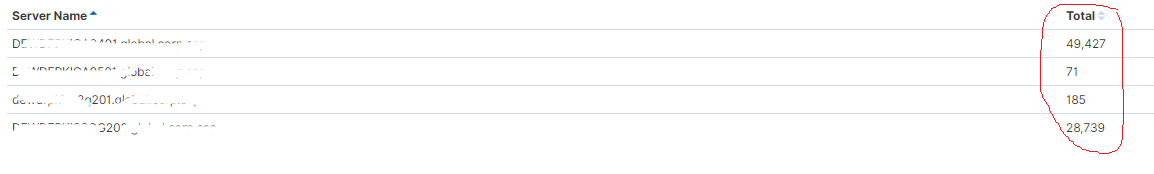
I have a data table which counts a total of certain parameter in each server. I need to filter and show in this table where the "Total" is more than "10,000". Other servers which has less than 10,000 is not significant to me so that I do not want them in the table.
What sort of a JSON input I should use to achieve this?

Untitled|690x104

Thanks!

Hi
I understand that you need a bucket script aggregations to filter results. There is a TSVB visualization can help you achieve bucket script aggregation:

This topic was automatically closed 28 days after the last reply. New replies are no longer allowed.