I tried a simplified version of your issue and got something to share. Maybe it is not exactly what you want but it may give you some pointers.
This is the data I used:
/* Clean up */
DELETE discuss-328714-data

/* Create a test index */
PUT discuss-328714-data
{
  "mappings": {
    "properties": {
      "ts": { "type": "date"},
      "ip": { "type": "keyword"},
      "proxy": { "type": "keyword"}
    }
  }
}

/* Add some data to the index */
POST discuss-328714-data/_bulk
{ "index": {}}
{"ts": "2023-03-13", "ip": "1.1.1.1", "proxy": "p1"}
{ "index": {}}
{"ts": "2023-03-14", "ip": "1.1.1.1", "proxy": "p1"}
{ "index": {}}
{"ts": "2023-03-15", "ip": "1.1.1.1", "proxy": "p1"}
{ "index": {}}
{"ts": "2023-03-16", "ip": "1.1.1.1", "proxy": "p1"}
{ "index": {}}
{"ts": "2023-03-13", "ip": "1.1.1.2", "proxy": "p1"}
{ "index": {}}
{"ts": "2023-03-14", "ip": "1.1.1.2", "proxy": "p2"}
{ "index": {}}
{"ts": "2023-03-15", "ip": "1.1.1.2", "proxy": "p1"}
{ "index": {}}
{"ts": "2023-03-16", "ip": "1.1.1.2", "proxy": "p2"}
{ "index": {}}
{"ts": "2023-03-13", "ip": "1.1.1.3", "proxy": "p2"}
{ "index": {}}
{"ts": "2023-03-14", "ip": "1.1.1.3", "proxy": "p2"}
{ "index": {}}
{"ts": "2023-03-15", "ip": "1.1.1.3", "proxy": "p2"}
{ "index": {}}
{"ts": "2023-03-16", "ip": "1.1.1.3", "proxy": "p2"}
So there is an index with a date, an IP, and a proxy identifier. I created a Data View on this index with the defaults.
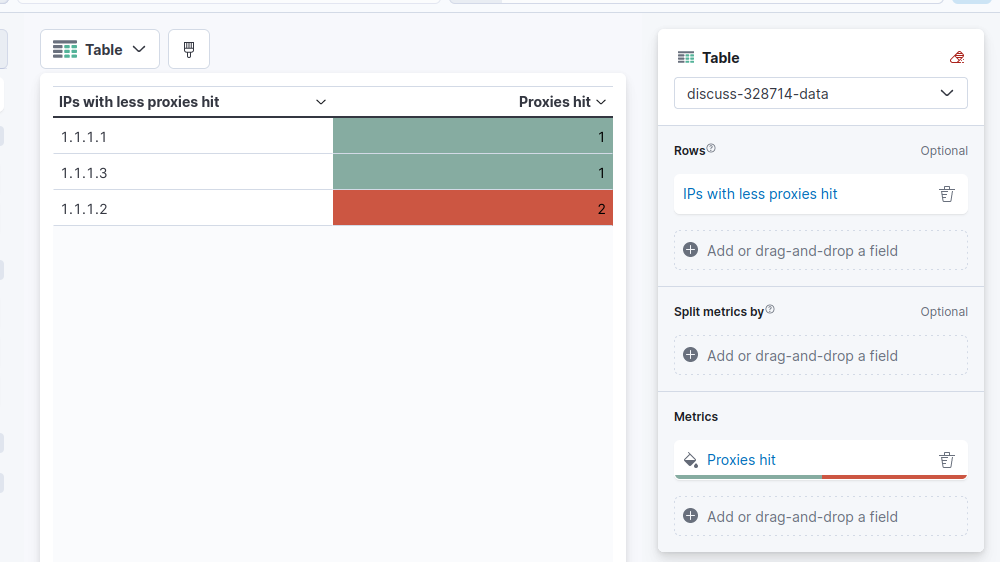
Then in Lens I created a table
These are the settings:
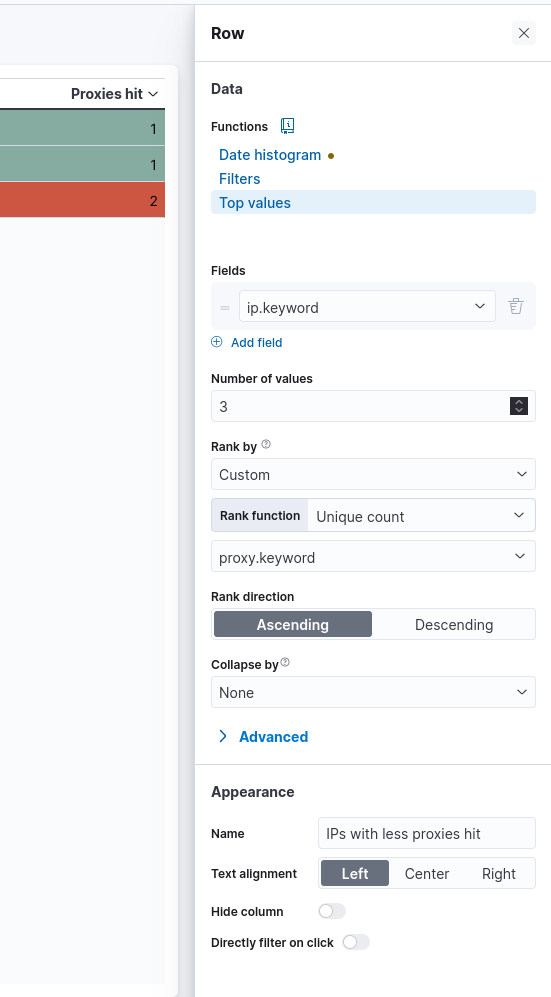
For rows I got the top values for IPs ranked by the ascending number of unique count on the proxy.keyword field so it lists first those hitting a single proxy
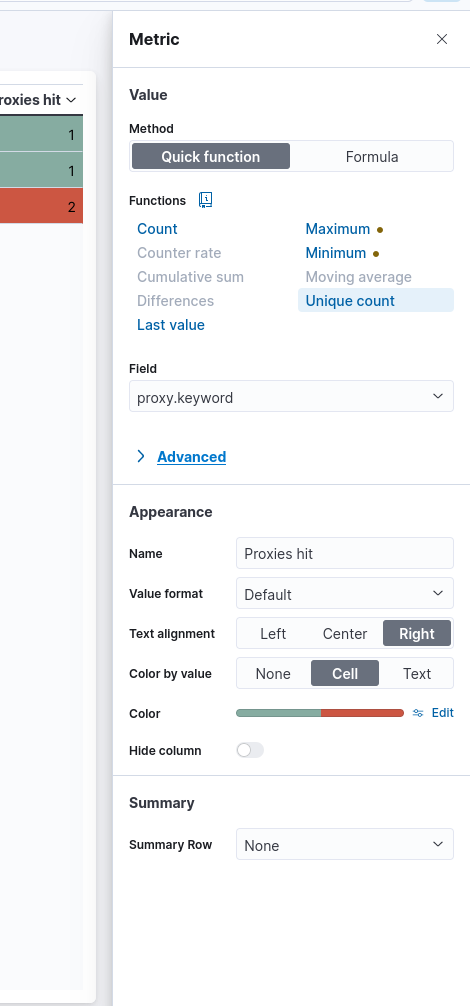
And then for the metric I again get the unique count for the proxy field adding a custom color ramp to render on green those with count 1 and in red those with count 2 or more, you get the idea.
That's it! let me know if this helps.