How can I fix my x-axis for a stacked bar chart?
please help! i use kibana 7.13.2
How can I fix my x-axis for a stacked bar chart?
please help! i use kibana 7.13.2
Hey, can you provide more context to your question? What does "fixing" mean? How does it look right now and how should it look?
![]() this is how my current visualization looks like.
this is how my current visualization looks like.
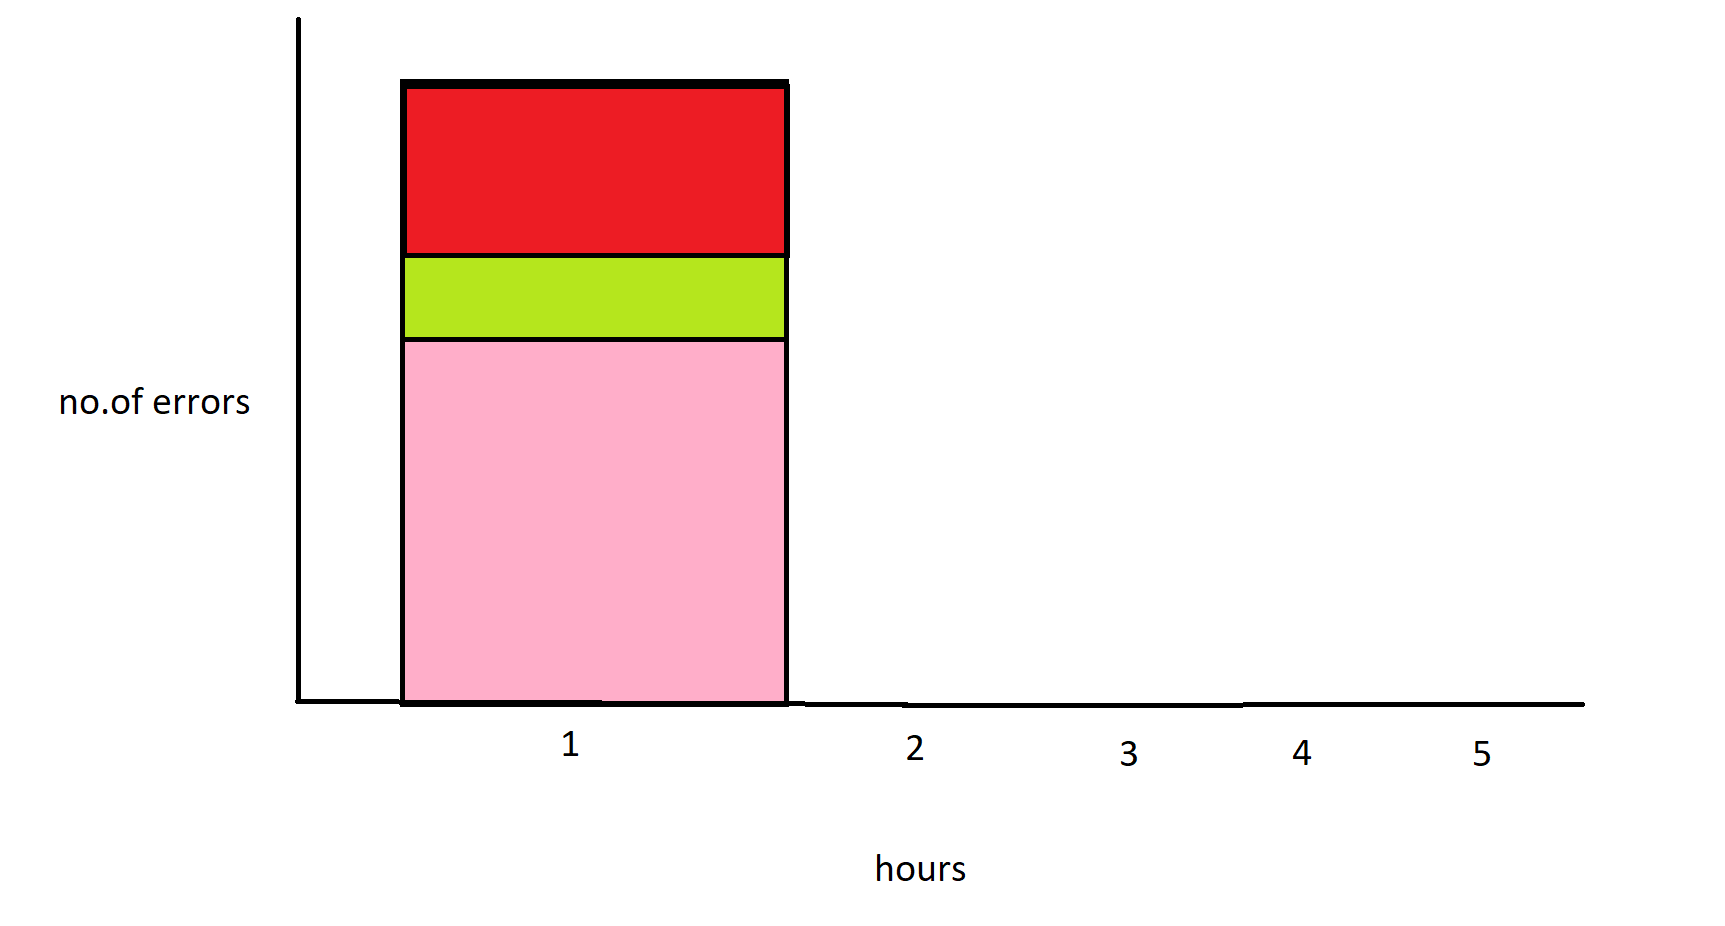
Here I have no.of errors generated in y axis and the time they were generated in x-axis.There are 3 types of errors i.e type A,type B,type C. Now when i apply a filter my other values in x-axis gets filtered out and it gets zoomed in. Something like this ![]()
Now my requirement is I need my x-axis to be static .I want my x-axis marks to be there always.I require a visualization just like ds ![]()
By fixing i mean 'static' .
As mentioned in the other post, you have to use the "filters" function for the x axis dimension, specifying the filter for each bar separately. Then they will continue to be displayed even if there is no data.
© 2020. All Rights Reserved - Elasticsearch
Apache, Apache Lucene, Apache Hadoop, Hadoop, HDFS and the yellow elephant logo are trademarks of the Apache Software Foundation in the United States and/or other countries.