Fleet Pipeline does not exist - Data Streams not getting data

I have elastic setup and working using regular beats fine. I have since setup fleet and trying to add servers using that. however I am seeing a bunch of errors about pipelines not existing, only for certain items. See an example below.

[elastic_agent.metricbeat][warn] Cannot index event publisher.Event{Content:beat.Event{Timestamp:time.Time{wall:0xc04f1568a69c8d10, ext:3720939793352, loc:(*time.Location)(0x564bda2ce700)}, Meta:{"raw_index":"metrics-system.process.summary-default"}, Fields:{"agent":{"ephemeral_id":"aba05f5e-49d8-4c29-ab20-736ecfe5b833","hostname":"pacc-intranet.pac.internal","id":"556d8a1b-10b4-49f4-96b8-4951d95d460c","name":"pacc-intranet.pac.internal","type":"metricbeat","version":"7.15.0"},"data_stream":{"dataset":"system.process.summary","namespace":"default","type":"metrics"},"ecs":{"version":"1.11.0"},"elastic_agent":{"id":"556d8a1b-10b4-49f4-96b8-4951d95d460c","snapshot":false,"version":"7.15.0"},"event":{"dataset":"system.process.summary","duration":25277107,"module":"system"},"host":{"architecture":"x86_64","containerized":false,"hostname":"pacc-intranet.pac.internal","id":"822f79372d6b43fc9557929197ffcb48","ip":["192.168.200.30","fe80::e7fe:aca2:ad20:dd7d"],"mac":["00:50:56:ad:00:46"],"name":"pacc-intranet.pac.internal","os":{"family":"","kernel":"4.18.0-305.7.1.el8_4.x86_64","name":"Rocky Linux","platform":"rocky","type":"linux","version":"8.4 (Green Obsidian)"}},"metricset":{"name":"process_summary","period":10000},"service":{"type":"system"},"system":{"process":{"summary":{"dead":0,"idle":79,"running":1,"sleeping":139,"stopped":0,"total":219,"unknown":0,"zombie":0}}}}, Private:interface {}(nil), TimeSeries:true}, Flags:0x0, Cache:publisher.EventCache{m:common.MapStr(nil)}} (status=400): {"type":"illegal_argument_exception","reason":"pipeline with id [metrics-system.process.summary-1.1.2] does not exist"}, dropping event!

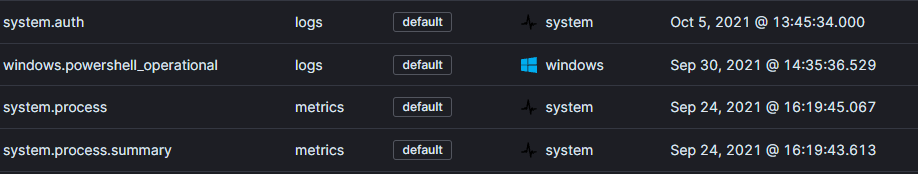
I am also not getting any data actually put into my data streams I assume because the pipelines do not exist. Again only on some though. I did upgrade to 7.15 from 7.14 but I can't remember what date that was exactly.

Is fleet supposed to make these pipelines automatically, I would assume so because some are working and I've never made one?

1 Like

Hi @Heroj04 we're experiencing the same issue with a large quantity of logging (Just purged a 58GB metricbeat-json log file). We have recently upgraded to 7.15 from 7.14 as well. Happy to provide logs to assist in resolving this one.

No luck yet.
I have reinstalled elastic-agent on the clients. I've reinstalled the agent on the server. defined new policies. removed and readded certain integrations.
All to no avail so far.
I'm thinking about looking for a way to clean install all the fleet configuration in elastic again. cant seem to think of anything.

Sounds like you've dome a similar thing to me, I've also rolled over the indices to see if that would help, but looks like it hasn't. @ruflin does anyone on the elastic team have any suggestions as to what we may be doing wrong here? Oh and a clarification to my previous post, the 58GB log file is the local metricbeat log file on the host that the agent is installed on.

I have had this a few times when upgrading fleet versions, as i always upgrade with every minor version.

Something happens in the upgrade / migration of pipelines that an Integration is upgraded and the pipeline for the latest version is not there. Happens more when you just upgrade just an Integration and not the Fleet stack whilst upgrading the ELK stack.

The only way i have found around this was to totally remove every instance of the Fleet Server Policy and it's agent and start with a fresh Fleet Server & Agents install, totally removing all data, files and folders.

There is certainly a problem that comes with upgrading existing fleet setups.

1 Like

I usually remove all traces of the agents via this command.. Just unenrolling and uninstalling the agent does not always remove all the files, folder and data.

sudo find / -type d,f -name "*elastic-agent*" -exec sudo rm -vr {} +```

Thanks @zx8086 not sure if I should wait for (hopefully) someone from the elastic team to pop up so that they can grab the diagnostics that they need or if I should go ahead an reinstate the whole config. We have Windows agents as well as linux, but I'd assume that it would be the same string I'm looking for anyway.

I've just been doing some more testing, removed fleet server/elastic-agent and created a new server policy to reinstall, still no luck.
Anybody how to completely remove the fleet configuration from elastic/kibana and just start fresh?

unenroll the fleet agents
uninstall elastic agents from server and clients
use this to remove the elastic agent data and files completely
install from scratch

sudo find / -type d,f -name "*elastic-agent*" -exec sudo rm -vr {} +
1 Like

I did give this a go but still was stuck with the same issue, it just would not create those pipelines again.
Since this is a new server I'm testing with, I ended up just completely blowing away ELK and it setting it up again. now it seems to be working correctly.
Will have to wait to see if it breaks again next update.

@Heroj04

Sounds like it was data / data corrupt related.

Thanks @zx8086
That did resolve the issue, however I'm a little disappointed that I have to blow away the agents on ~30 fleet servers each time there is an integration update. Hopefully the elastic team can work to resolve this glitch or provide some more pointed advice on how to resolve this issue. Not sure why the updated pipelines weren't automatically created.

Thanks Again

@hamiland, No problem, I had to do the same and hence why I logged the call with elastic team. It seems to be better with 7.15.1, so fingers crossed.

I think if this happens again, just the Elastic-Agent on the Fleet server might resolve the problem. My test setup if 5 agents and it is automated, so usually this isn't a big pain. I would advise to automate that, so it isn't a pain however large your estate becomes.

1 Like

Hi all, thanks for being some of our first adopters of Fleet and Elastic Agent. It seems you all have encountered one of our rough spots in integration upgrades. This is definitely not the experience we want and is something we're planning to address in an upcoming release as part of [Fleet] Handle common transient errors during package installs with a retry · Issue #111859 · elastic/kibana · GitHub.

In the meantime, there is an API workaround you can use to force these assets to be reinstalled without having to wipe everything and start over. This command will force the base package to be reinstalled:

curl -XPOST \
  --url http://<your kibana host>/api/fleet/epm/packages/system-1.1.2 \
  -u <username>:<password> \
  -H 'content-type: application/json' \
  -H 'kbn-xsrf: x' \
  --data '{"force": true}'

You'll want to be sure you use the correct version number at the end of the URL (I used 1.1.2 here). You can see which version is currently installed by visiting http://<your kibana host>/app/integrations/detail/system/settings. This can also be used for other packages as well, just change the system in the URL to another package name and use the correct version number.

I hope this helps!

Hii

Unfortunatly that command didn't create the pipes for me (ES 7.15.1, System 1.4.0), but it did re-install the dashboards

:(((

Hi, do you know which pipeline specifically you were getting an error about? If it was a pipeline with a name similar to .fleet_final_pipeline, these steps will not fix the problem, but they should fix the issue for the integration-specific pipelines.

1 Like

Thank you for helping!

Here's an example of which ones are showing in error logs as missing (non exhaustive):

metrics-system.process-1.4.0
metrics-system.network-1.4.0
metrics-system.diskio-1.4.0
metrics-system.process.summary-1.4.0
metrics-system.uptime-1.4.0
metrics-system.socket_summary-1.4.0
metrics-system.memory-1.4.0
metrics-windows.perfmon-1.0.0
metrics-iis.webserver-0.5.0
metrics-windows.service-1.0.0

In the output from your command aimed at /system-1.4.0 the only "pipeline" entries in the JSON response are for logs-system., can't see anything for metrics-system., but maybe I am misunderstanding.

{"response":[{"id":"system-01c54730-fee6-11e9-8405-516218e3d268","type":"dashboard"}, ... ,{"id":"system-ffebe440-f419-11e9-8405-516218e3d268","type":"visualization"},{"id":"system-06b6b060-7a80-11ea-bc9a-0baf2ca323a3","type":"search"},{"id":"system-324686c0-fefb-11e9-8405-516218e3d268","type":"search"},{"id":"system-62439dc0-f9c9-11e6-a747-6121780e0414","type":"search"},{"id":"system-6f4071a0-7a78-11ea-bc9a-0baf2ca323a3","type":"search"},{"id":"system-757510b0-a87f-11e9-a422-d144027429da","type":"search"},{"id":"system-7e178c80-fee1-11e9-8405-516218e3d268","type":"search"},{"id":"system-8030c1b0-fa77-11e6-ae9b-81e5311e8cab","type":"search"},{"id":"system-9066d5b0-fef2-11e9-8405-516218e3d268","type":"search"},{"id":"system-Syslog-system-logs","type":"search"},{"id":"system-b6f321e0-fa25-11e6-bbd3-29c986c96e5a","type":"search"},{"id":"system-ce71c9a0-a25e-11e9-a422-d144027429da","type":"search"},{"id":"system-eb0039f0-fa7f-11e6-a1df-a78bd7504d38","type":"search"},{"id":"logs-system.auth-1.4.0","type":"ingest_pipeline"},{"id":"logs-system.application-1.4.0","type":"ingest_pipeline"},{"id":"logs-system.security-1.4.0","type":"ingest_pipeline"},{"id":"logs-system.system-1.4.0","type":"ingest_pipeline"},{"id":"logs-system.syslog-1.4.0","type":"ingest_pipeline"},{"id":"logs-system.auth","type":"index_template"},{"id":"logs-system.auth@custom","type":"component_template"},{"id":"metrics-system.core","type":"index_template"},{"id":"metrics-system.core@custom","type":"component_template"},{"id":"logs-system.application","type":"index_template"},{"id":"logs-system.application@custom","type":"component_template"},{"id":"metrics-system.cpu","type":"index_template"},{"id":"metrics-system.cpu@custom","type":"component_template"},{"id":"metrics-system.filesystem","type":"index_template"},{"id":"metrics-system.filesystem@custom","type":"component_template"},{"id":"metrics-system.load","type":"index_template"},{"id":"metrics-system.load@custom","type":"component_template"},{"id":"logs-system.security","type":"index_template"},{"id":"logs-system.security@custom","type":"component_template"},{"id":"metrics-system.memory","type":"index_template"},{"id":"metrics-system.memory@custom","type":"component_template"},{"id":"metrics-system.process.summary","type":"index_template"},{"id":"metrics-system.process.summary@custom","type":"component_template"},{"id":"metrics-system.process","type":"index_template"},{"id":"metrics-system.process@custom","type":"component_template"},{"id":"metrics-system.network","type":"index_template"},{"id":"metrics-system.network@custom","type":"component_template"},{"id":"logs-system.system","type":"index_template"},{"id":"logs-system.system@custom","type":"component_template"},{"id":"logs-system.syslog","type":"index_template"},{"id":"logs-system.syslog@custom","type":"component_template"},{"id":"metrics-system.diskio","type":"index_template"},{"id":"metrics-system.diskio@custom","type":"component_template"},{"id":"metrics-system.fsstat","type":"index_template"},{"id":"metrics-system.fsstat@custom","type":"component_template"},{"id":"metrics-system.socket_summary","type":"index_template"},{"id":"metrics-system.socket_summary@custom","type":"component_template"},{"id":"metrics-system.uptime","type":"index_template"},{"id":"metrics-system.uptime@custom","type":"component_template"}]}

(had to cut out the middle bit for character limit, it only mentioned visualizations)

Perhapse the ~1.4.0 version misses out installing the metrics-sytsem pipelines with this method?

Thank you :))

Thanks for the additional detail here.

After digging in a bit more, what's odd is that none of these pipelines should exist. These data streams are not intended to have a pipeline in the current version of these packages. What's even more curious is that I am unable to reproduce this situation.

If you're up for it, I'd like to get some additional information and offer a potential workaround. For this investigation, let's use the metrics-system.process as example to work with. The same could be applied to any others.

  1. First let's see what is pointing to the non-existent metrics-system.process-1.4.0. Could you run the following command for me from Dev Tools in Kibana:
    GET /_index_template/metrics-system.process?filter_path=index_templates.index_template.template.settings.index.default_pipeline
    
  2. If that returns an empty response, then the reinstall most likely worked. Let's see if this setting is still present on the current concrete index:
    GET /metrics-system.process-*/_settings?filter_path=*.settings.index.default_pipeline
    
  3. If any of these indices return a non-empty value AND the template request from (1) was empty, then it's like that rolling over the data stream should fix the issue. Here's the command to try this. Note you'd need to change default if you customized the namespace:
    POST /metrics-system.process-default/_rollover
    

This last command would need to be repeated for each of these data streams. There is no bulk API for this. Another option could be to delete the underlying indices if you don't need the data:

DELETE /logs-*,metrics-*

Would really like to hear if this works for you and what your results are. We're not yet sure of a root cause here so anything you can share would be helpful in making sure that we can fix this bug.

1 Like

Thank you for taking time looking into this, I'll definitly help!

Since it's in this funny state I'm happy to try things and send any logs+output before I blitz metrics off like the previous users said worked for them.

This particular Docker E+K system moved from Beats -> Fleet on release version 7.14.0 if I remember correctly, then its been on 7.14.0 -> 7.14.1 -> 7.15.0 -> 7.15.1; I think it only started doing this after going from 7.14.1 to 7.15.0.

  1. The command to get the process templates returns the following:

    { "index_templates" : [ { "index_template" : { "template" : { "settings" : { "index" : { "default_pipeline" : "metrics-system.process-1.4.0" } } } } } ] }
    
  2. Is the above saying that metrics-system.process is trying to use metrics-system.process-1.4.0? Here's query two asking about indecise, there's 3 datastreams mentioning metrics-system.process-1.4.0:

    {
      ".ds-metrics-system.process-default-2021.09.10-000002" : {
        "settings" : {
          "index" : {
            "default_pipeline" : "metrics-system.process-1.4.0"
          }
        }
      },
      ".ds-metrics-system.process-default-2021.10.10-000003" : {
        "settings" : {
          "index" : {
            "default_pipeline" : "metrics-system.process-1.4.0"
          }
        }
      },
      ".ds-metrics-system.process-default-2021.08.11-000001" : {
        "settings" : {
          "index" : {
            "default_pipeline" : "metrics-system.process-1.4.0"
          }
        }
      }
    }
    
  3. The result from the first command looked rather non-empty to me, so rolling over would just use the same non existant pipeline right?

I'm not too bothered about losing metric data but I do very much need to keep other data (logs, audits, etc.), it's a production system but for a domain we're not that bothered about haha.

Thanks for providing these details! After some deeper investigation, @nchaulet was able to reproduce this, find a workaround, and we have a fix that will be included in an upcoming release.

The bug came down to an issue with an in-memory cache in Kibana, so the fix is largely the same as I first mentioned in my first post on this topic with a couple additional steps:

  1. First and foremost, restart Kibana.
  2. Force reinstall the package using a request like (using the correct version, see my linked post above on how to find):
    curl -XPOST \
      --url http://<your kibana host>/api/fleet/epm/packages/system-1.1.2 \
      -u <username>:<password> \
      -H 'content-type: application/json' \
      -H 'kbn-xsrf: x' \
      --data '{"force": true}'
    
  3. Rollover the data streams that are having this problem. You will need to do this for each stream having issues. You can do this from the Dev Tools app in Kibana with commands like:
    POST /metrics-system.process-default/_rollover
    
    • You'll need to do this for each data stream in the package. You can find these streams in the Fleet app under the "Data streams" tab and filter by the integration name.
1 Like