Fleet server configuration lost

Hello,

Today I set out to update elastic to version 8.18.1 which is the one available in the repositories of artifacts.elastic.co I don't know why 9.0 is not there which is supposed to be the latest but for now I will skip that since I have a bigger problem.

It turns out that I managed to update correctly to version 8.18.1 logstas, elasticsearch and kibana but I made a mistake when updating the agent that is on the server that I use only for fleet server and as you know the .yml file is as newly installed.

From Kibana in Fleet I see all the agents in offline status, I need help to recover this configuration I will be dead if I have to reinstall agent by agent to enroll to fleet server again.

I have access to the token, I don't know if this will solve my problem.

How exactly did you upgrade the Agent? It is not clear what you did.

Do you have a fleet server running on the same server?

Hello, thank you very much for replying

First I ran the command sudo elastic-agent upgrade 8.18.1 and I got an error possibly caused because it was not detected in the repositories

I updated the repositories and when it was available instead of upgrading I hit install and it seems that this overwrote the elastic-agent.yml file.

In answer to your question, if it is the same fleet server that I have always used, it is the same fleet server that I have always used.

root@fleetserver:/opt/Elastic/Agent# cd /opt/
root@fleetserver:/opt# ls
Elastic
root@fleetserver:/opt# cd Elastic/Agent/
root@fleetserver:/opt/Elastic/Agent# ls
data                             elastic-agent-20250527-2.ndjson  elastic-agent.reference.yml                    LICENSE.txt  watcher.lock
elastic-agent                    elastic-agent-20250527.ndjson    elastic-agent.yml                              NOTICE.txt
elastic-agent-20250526-1.ndjson  elastic-agent-20250528-1.ndjson  elastic-agent.yml.2024-06-10T21-16-29.893.bak  otel.yml
elastic-agent-20250526-2.ndjson  elastic-agent-20250528-2.ndjson  fleet.enc                                      README.md
elastic-agent-20250527-1.ndjson  elastic-agent-20250528.ndjson    fleet.enc.lock                                 vault
root@fleetserver:/opt/Elastic/Agent# systemctl status elastic-agent
â—Ź elastic-agent.service - Elastic Agent is a unified agent to observe, monitor and protect your system.
     Loaded: loaded (/etc/systemd/system/elastic-agent.service; enabled; vendor preset: enabled)
     Active: active (running) since Wed 2025-05-28 11:37:06 -05; 2h 43min ago
   Main PID: 548068 (elastic-agent)
      Tasks: 53 (limit: 9387)
     Memory: 404.1M
        CPU: 49.012s
     CGroup: /system.slice/elastic-agent.service
             ├─548068 /usr/share/elastic-agent/bin/elastic-agent --path.home /var/lib/elastic-agent --path.config /etc/elastic-agent --path.logs /var/log/el>
             ├─548090 /var/lib/elastic-agent/data/elastic-agent-8.18.1-a69672/components/agentbeat metricbeat -E setup.ilm.enabled=false -E setup.template.e>
             ├─548118 /var/lib/elastic-agent/data/elastic-agent-8.18.1-a69672/components/agentbeat filebeat -E setup.ilm.enabled=false -E setup.template.ena>
             ├─548141 /var/lib/elastic-agent/data/elastic-agent-8.18.1-a69672/components/agentbeat metricbeat -E setup.ilm.enabled=false -E setup.template.e>
             └─548158 /var/lib/elastic-agent/data/elastic-agent-8.18.1-a69672/components/agentbeat metricbeat -E setup.ilm.enabled=false -E setup.template.e>

May 28 14:19:56 fleetserver elastic-agent[548068]: {"log.level":"error","@timestamp":"2025-05-28T14:19:56.742-0500","message":"Failed to connect to backoff(>
May 28 14:19:56 fleetserver elastic-agent[548068]: {"log.level":"info","@timestamp":"2025-05-28T14:19:56.742-0500","message":"Attempting to reconnect to bac>
May 28 14:19:56 fleetserver elastic-agent[548068]: {"log.level":"error","@timestamp":"2025-05-28T14:19:56.743-0500","message":"Error dialing dial tcp 127.0.>
May 28 14:20:07 fleetserver elastic-agent[548068]: {"log.level":"info","@timestamp":"2025-05-28T14:20:07.509-0500","message":"Non-zero metrics in the last 3>
May 28 14:20:07 fleetserver elastic-agent[548068]: {"log.level":"info","@timestamp":"2025-05-28T14:20:07.881-0500","message":"Non-zero metrics in the last 3>
May 28 14:20:08 fleetserver elastic-agent[548068]: {"log.level":"info","@timestamp":"2025-05-28T14:20:08.429-0500","message":"Non-zero metrics in the last 3>
May 28 14:20:08 fleetserver elastic-agent[548068]: {"log.level":"info","@timestamp":"2025-05-28T14:20:08.554-0500","message":"Non-zero metrics in the last 3>
May 28 14:20:10 fleetserver elastic-agent[548068]: {"log.level":"error","@timestamp":"2025-05-28T14:20:10.035-0500","message":"Failed to connect to backoff(>
May 28 14:20:10 fleetserver elastic-agent[548068]: {"log.level":"info","@timestamp":"2025-05-28T14:20:10.035-0500","message":"Attempting to reconnect to bac>
May 28 14:20:10 fleetserver elastic-agent[548068]: {"log.level":"error","@timestamp":"2025-05-28T14:20:10.036-0500","message":"Error dialing dial tcp 127.0.

this is what my agents currently look like :smiling_face_with_tear:

this is what the elastic-agent.yml file currently looks like

Your agents are offline because you do not have a fleet server running.

For Fleet Managed agents you do not touch the elastic-agent.yml file, so if instead of upgrading the agent running fleet server you accidentally executed the install command, it may have overwritten the elastic-agent.yml used by the fleet server.

I don't think you can recover the old configuration, so you will probably need to reinstall the fleet server in the same server using the same certificates that you used on the first time.

If this work you may have a healthy fleet server and your agents may appear online, but if this does not work you may need to reenroll all agents.

Anything works for me that doesn't require re-enrolling each agent one by one on each server.

What would be the process to rule out this possibility?

I don't think you can rule this out, it may be required.

Forgive me if I got lost in the explanation you gave me.

I see that you mention the security certificates as the server is the same must be somewhere just a question of looking for them, that would help me to specify them in the .yml of elastic-agent that has the role of fleet so that later the agents that connect to it again register online?

Additionally I see that the same fleet server appears from kibana as offline but the server is up and the service as well.

Sorry if this is confusing

other than this information I already have, what else do I need?

You need to provide a little more context, is your agent Fleet Managed or Standalone agents?

With Fleet managed agents you do not touch the yml files, you cannot edit them, everything is done through the fleet interface.

Since you have agents on Fleet I'm assuming that your agents are Fleet managed, so not sure why you are trying to edit yml files, you cannot do that.

Do you remember how you installed the Fleet Server? When you install it you run a command line where you pass a series of parameters including the certificates used.

You need to run the same command again.

Hi @leandrojmp

Thanks again for taking the time to help me

Effectively I have a server only for fleet server, if you tell me that I should not modify the files, I will leave everything as it was, what I do is in order to try to solve the problem I have at the moment in my desperation.

This is the configuration

The fleet server when it was added was done like this

When I enter advanced I get these options

I look forward to hearing from you.

Thank you

Do you have the exact command that you executed when you installed the Fleet Server?

The main issue here is that I'm not sure that just installing it again will solve your issue because I do not know how it creates the certificate in this case, and if the certificate is different your agents may still not be able to communicate with Fleet.

If you do not have the command that you used in your history, then the option is to just go ahead and still it as a new fleet server.

But as mentioned, it still possible that you will need to reenroll all agents.

Hello,

I do not have the commands with which I performed the installation.

The certificates are intact, only the agent was rewritten in the previous version when instead of updating I gave install, since this began to present the problem.

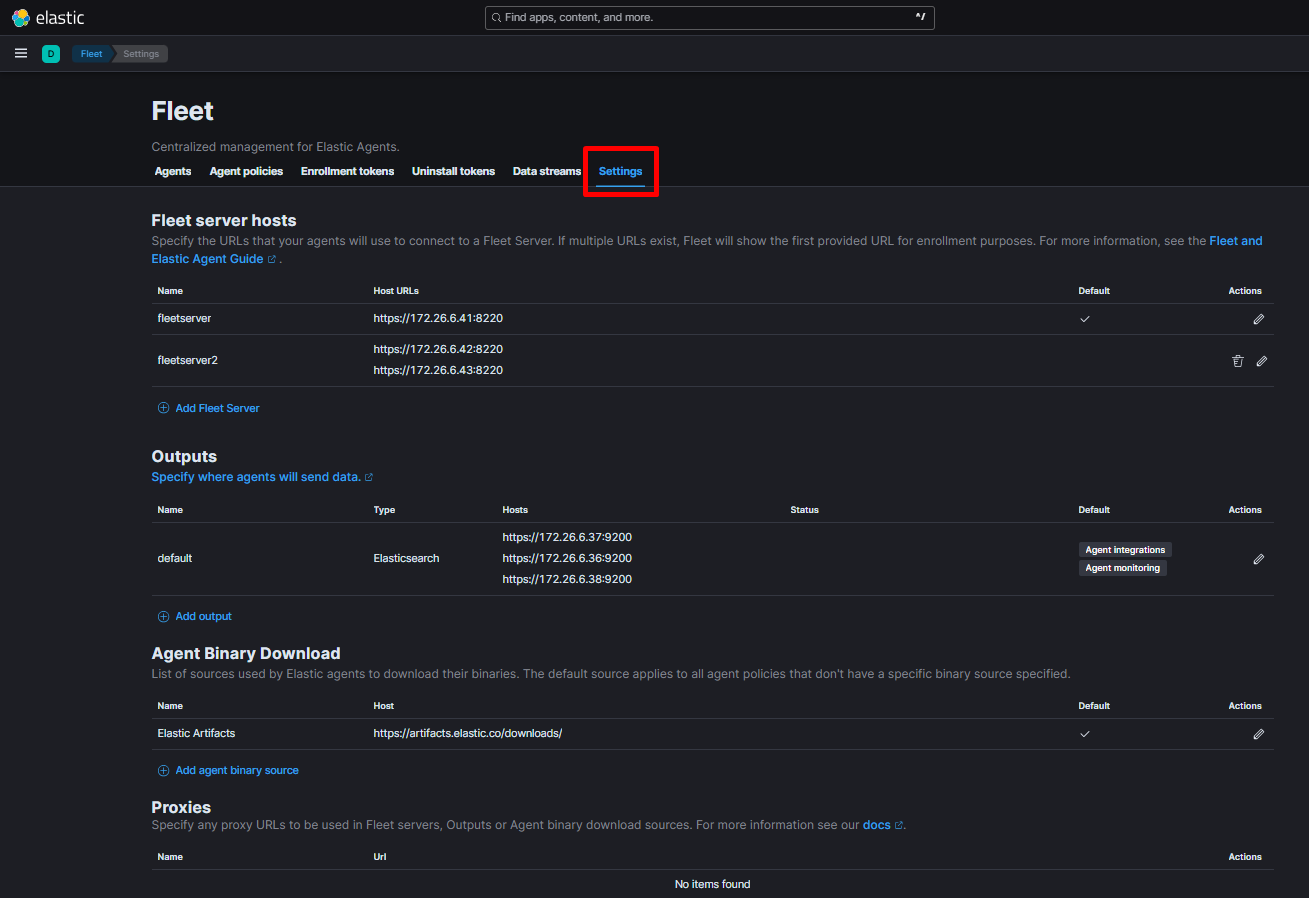
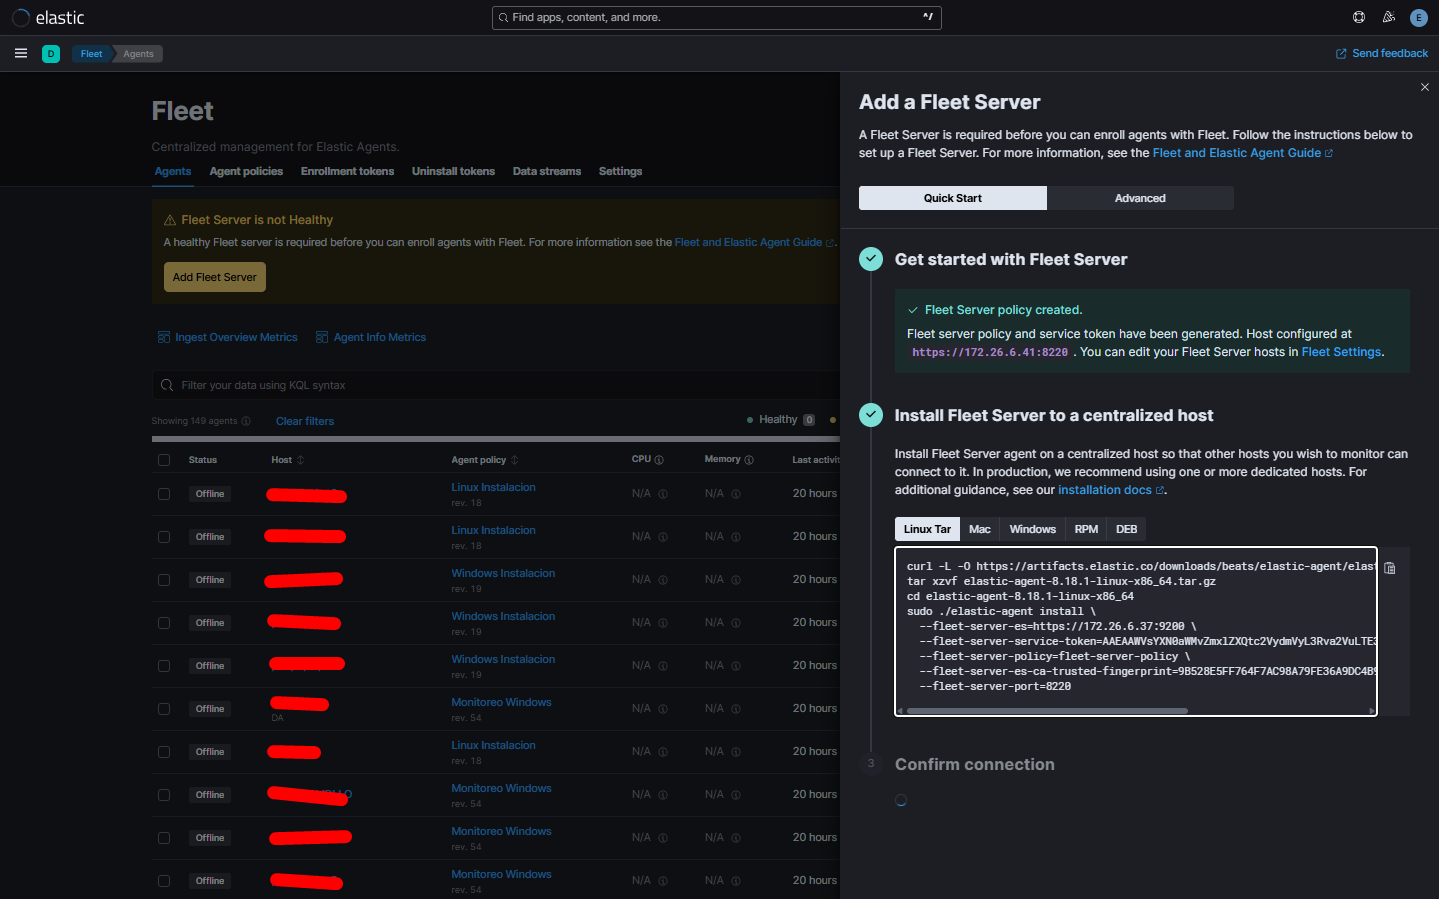
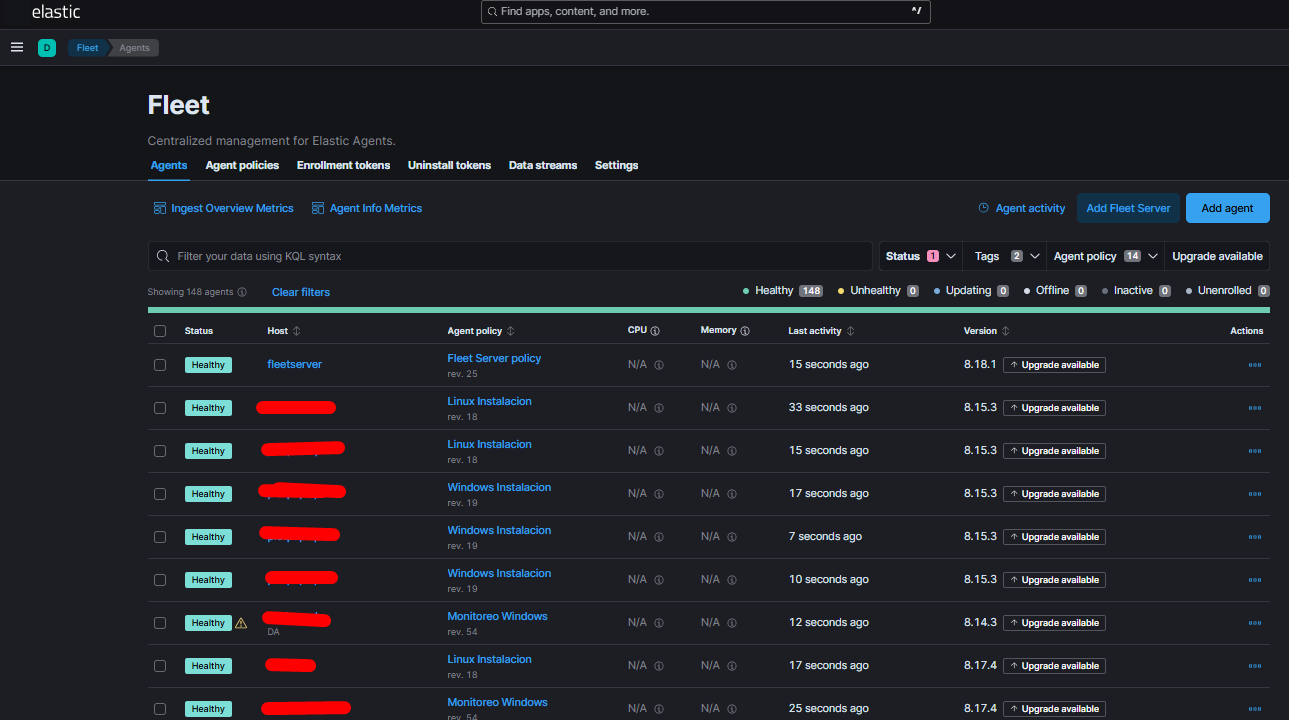
I need the agent that is in the fleet server to enroll again so that the other agents are online.

I generated a new service token

I share what I have executed and the errors that I see at the moment.

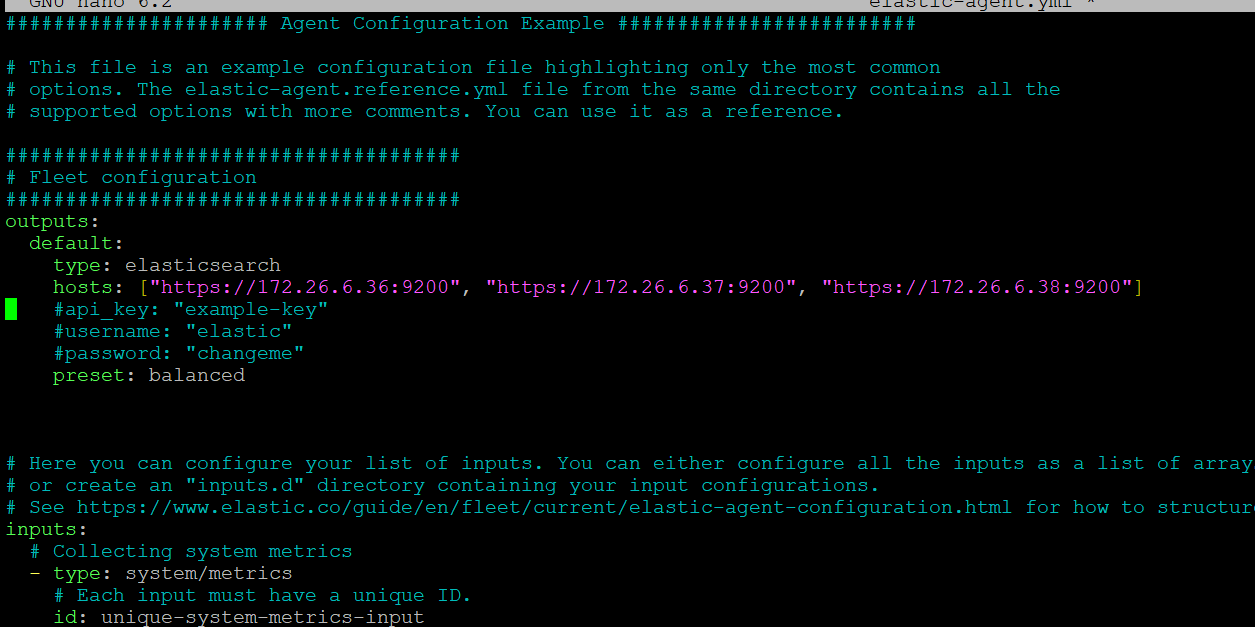
sudo /opt/elastic-agent-8.18.1-linux-x86_64/elastic-agent install \
--url="https://172.26.6.39:5601" \
--fleet-server-es="https://172.26.6.37:9200" \
--fleet-server-service-token="xxxxxxxxxxxxxxxxxxxxxxxxxxxxxxxxxxxxxxxxxxxxxxxxxxxxxxxxxxxxxxxxxxxxxxxxxxxxxxxxxxxxxxxxxx" \
--fleet-server-policy="fleet-server-policy" \
--fleet-server-es-ca-trusted-fingerprint="xxxxxxxxxxxxxxxxxxxxxxxxxxxxxxxxxxxxxxxxxxxxxxxxxxxxxxx" \
--fleet-server-host="172.26.6.41" \
--fleet-server-port=8220 \
--fleet-server-cert="/etc/certs/elacluster/fleetserver.crt" \
--fleet-server-cert-key="/etc/certs/elacluster/fleetserver.key"
Elastic Agent will be installed at /opt/Elastic/Agent and will run as a service. Do you want to continue? [Y/n]:Y
[=== ] Service Started  [10s] Elastic Agent successfully installed, starting enrollment.
[====] Waiting For Enroll...  [12s] {"log.level":"info","@timestamp":"2025-05-29T10:45:38.325-0500","log.origin":{"function":"github.com/elastic/elastic-agent/internal/pkg/agent/cmd.(*enrollCmd).daemonReloadWithBackoff","file.name":"cmd/enroll_cmd.go","file.line":495},"message":"Restarting agent daemon, attempt 0","ecs.version":"1.6.0"}
[   =] Waiting For Enroll...  [14s] {"log.level":"info","@timestamp":"2025-05-29T10:45:40.330-0500","log.origin":{"function":"github.com/elastic/elastic-agent/internal/pkg/agent/cmd.waitForFleetServer.func1","file.name":"cmd/enroll_cmd.go","file.line":809},"message":"Waiting for Elastic Agent to start Fleet Server","ecs.version":"1.6.0"}
[    ] Waiting For Enroll...  [18s] {"log.level":"info","@timestamp":"2025-05-29T10:45:44.337-0500","log.origin":{"function":"github.com/elastic/elastic-agent/internal/pkg/agent/cmd.waitForFleetServer.func1","file.name":"cmd/enroll_cmd.go","file.line":823},"message":"Fleet Server - Running on policy with Fleet Server integration: fleet-server-policy; missing config fleet.agent.id (expected during bootstrap process)","ecs.version":"1.6.0"}
[   =] Waiting For Enroll...  [18s] {"log.level":"info","@timestamp":"2025-05-29T10:45:44.359-0500","log.origin":{"function":"github.com/elastic/elastic-agent/internal/pkg/agent/cmd.(*enrollCmd).enrollWithBackoff","file.name":"cmd/enroll_cmd.go","file.line":532},"message":"Starting enrollment to URL: https://172.26.6.39:5601/","ecs.version":"1.6.0"}
[ ===] Waiting For Enroll...  [18s] {"log.level":"info","@timestamp":"2025-05-29T10:45:44.597-0500","log.origin":{"function":"github.com/elastic/elastic-agent/internal/pkg/agent/cmd.(*enrollCmd).enrollWithBackoff","file.name":"cmd/enroll_cmd.go","file.line":538},"message":"1st enrollment attempt failed, retrying enrolling to URL: https://172.26.6.39:5601/ with exponential backoff (init 5s, max 10m0s)","ecs.version":"1.6.0"}
{"log.level":"warn","@timestamp":"2025-05-29T10:45:44.597-0500","log.origin":{"function":"github.com/elastic/elastic-agent/internal/pkg/agent/cmd.(*enrollCmd).enrollWithBackoff","file.name":"cmd/enroll_cmd.go","file.line":557},"message":"Enrollment failed: fail to execute request to fleet-server: status code: 404, fleet-server returned an error: Not Found, message: Not Found","ecs.version":"1.6.0"}
Error: fail to enroll: fail to execute request to fleet-server: status code: 404, fleet-server returned an error: Not Found, message: Not Found
For help, please see our troubleshooting guide at https://www.elastic.co/guide/en/fleet/8.18/fleet-troubleshooting.html
[====] Uninstalled  [19s] Error uninstalling. Printing logs
2025-05-29T15:45:44.839Z        DEBUG   [install]       Loaded configuration from /opt/elastic-agent-8.18.1-linux-x86_64/elastic-agent.yml
2025-05-29T15:45:44.839Z        DEBUG   [install]       Merged configuration from /opt/elastic-agent-8.18.1-linux-x86_64/elastic-agent.yml into result
2025-05-29T15:45:44.839Z        DEBUG   [install]       Merged all configuration files from [/opt/elastic-agent-8.18.1-linux-x86_64/elastic-agent.yml], no external input files
2025-05-29T15:45:44.927Z        DEBUG   [install]       Loaded configuration from /opt/elastic-agent-8.18.1-linux-x86_64/elastic-agent.yml
2025-05-29T15:45:44.927Z        DEBUG   [install]       Merged configuration from /opt/elastic-agent-8.18.1-linux-x86_64/elastic-agent.yml into result
2025-05-29T15:45:44.927Z        DEBUG   [install]       Merged all configuration files from [/opt/elastic-agent-8.18.1-linux-x86_64/elastic-agent.yml], no external input files
2025-05-29T15:45:44.927Z        DEBUG   [install.composable]    Starting controller for composable inputs
2025-05-29T15:45:44.927Z        DEBUG   [install.composable]    Started controller for composable inputs
2025-05-29T15:45:44.927Z        DEBUG   [install.composable]    Computing new variable state for composable inputs
2025-05-29T15:45:44.927Z        DEBUG   [install.composable]    Stopping controller for composable inputs
2025-05-29T15:45:44.927Z        DEBUG   [install.composable]    Stopped controller for composable inputs
Error: enroll command failed for unknown reason: exit status 1
For help, please see our troubleshooting guide at https://www.elastic.co/guide/en/fleet/8.18/fleet-troubleshooting.html

I have no idea what can cause this error.

Did you had the agent installed on this server before?

I recommend that you remove any traces of it, uninstall it, delete the /opt/Elastic folder and them try to install it again.

1 Like

I must confess that google AI helped me a lot to diagnose the problem and the possible causes allowing me to clarify the difference between “Enrollment token” and “Service token”, search for the .crt, .ca and .key and get the fingerprint.

But at the same time due to a problem of interpretation of the same AI I reached a point where I started to go around the error that I mentioned, the cause was that the field “--url” the AI suggested me the ip and port of kibana when I really should have the ip and port of the fleet server.

@leandrojmp from the bottom of my heart I thank you for your valuable help and excellent disposition to help those of us who visit this forum since the documentation can become very dense and we need the help of someone who is selflessly willing to support us.

Did it work without having to reenroll the agents?

Yes, the rest of the agents were offline because the agent that was in the fleetserver was the one that had problems, when the fleet server agent was reenrolled the other agents started to upload.