Get sum of created metrics

what i need to get is get top hits for each TYPE and need to get the summation of them.

For this example summation should be 25(1+1+1+22). .Can i get 25 as in one metric visual so that i can add to dashboard as one single visual.

current workflow:

Sample data:

|timestamp ID Name Count

|1/18/2022 |1 |A |22 |
|1/17/2022 |2 |A |45 |
|1/16/2022 |3 |A |2 |
|1/15/2022 |3 |C |1 |
|1/12/2022 |1 |C |8 |
|1/11/2022 |5 |B |1 |
|1/10/2022 |3 |D |1 |
|1/09/2022 |1 |B |4 |
|1/08/2022 |3 |B |2 |

Highlighted values are the top hits(based on timestamp) for each Type. So need to get distinct summation.(22+1+1+1)

So i got the top hits for each catagory and split by type . But i have no idea to get the summation

1 Like

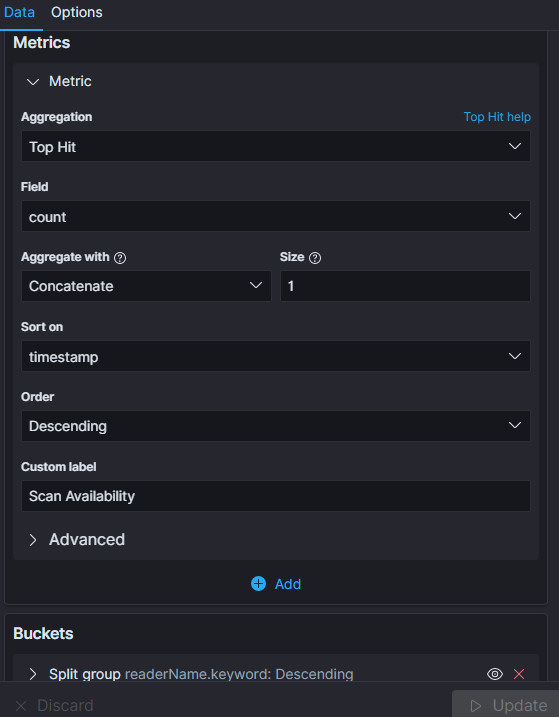
Are you really sure you want Top Hits...... top hits is the most common... you just happen to be setting to 1 and getting the last because you are sorting...

Seems if I read your data right you want the Sum of Count for each of the Last Entry based on the timestamp for each Name.... Is that correct?

What version of the Stack are you on?

I can show you how to do this..

1 Like

Yaa. You got it right. But need to show only 25 as a visual. Other things should not disply. Only the summation value need to be displayed. Not a table.

Not sure how to do it without the table and TSVB does not have that last value in it as far as I know. So I'm not sure how to do that today.

If I get a chance I'll poke at it some more.

1 Like

If you know beforehand each type name I guess you can use Lens formula for that in a Metric visualization?

last_value( Count, kql='Name: A') +  last_value( Count, kql='Name: B') + last_value( Count, kql='Name: C') + etc...
2 Likes

Hi,

Cant see the Lens?

What version of the stack do you have?

This topic was automatically closed 28 days after the last reply. New replies are no longer allowed.