👀 Host.network.ingress.bytes looks broken

Hi! I have a Docker Swarm cluster with 4 nodes and Metricbeat installed on every node as a global service.

According to docs:

host.network.ingress.bytes
The number of bytes received (gauge) on all network interfaces by the host since the last metric collection.

But in my case, this field always has almost the same values as before even if I start downloading or uploading big files (5Gb) at a high speed in one of the containers of the cluster (traffic goes through the host to the global network).

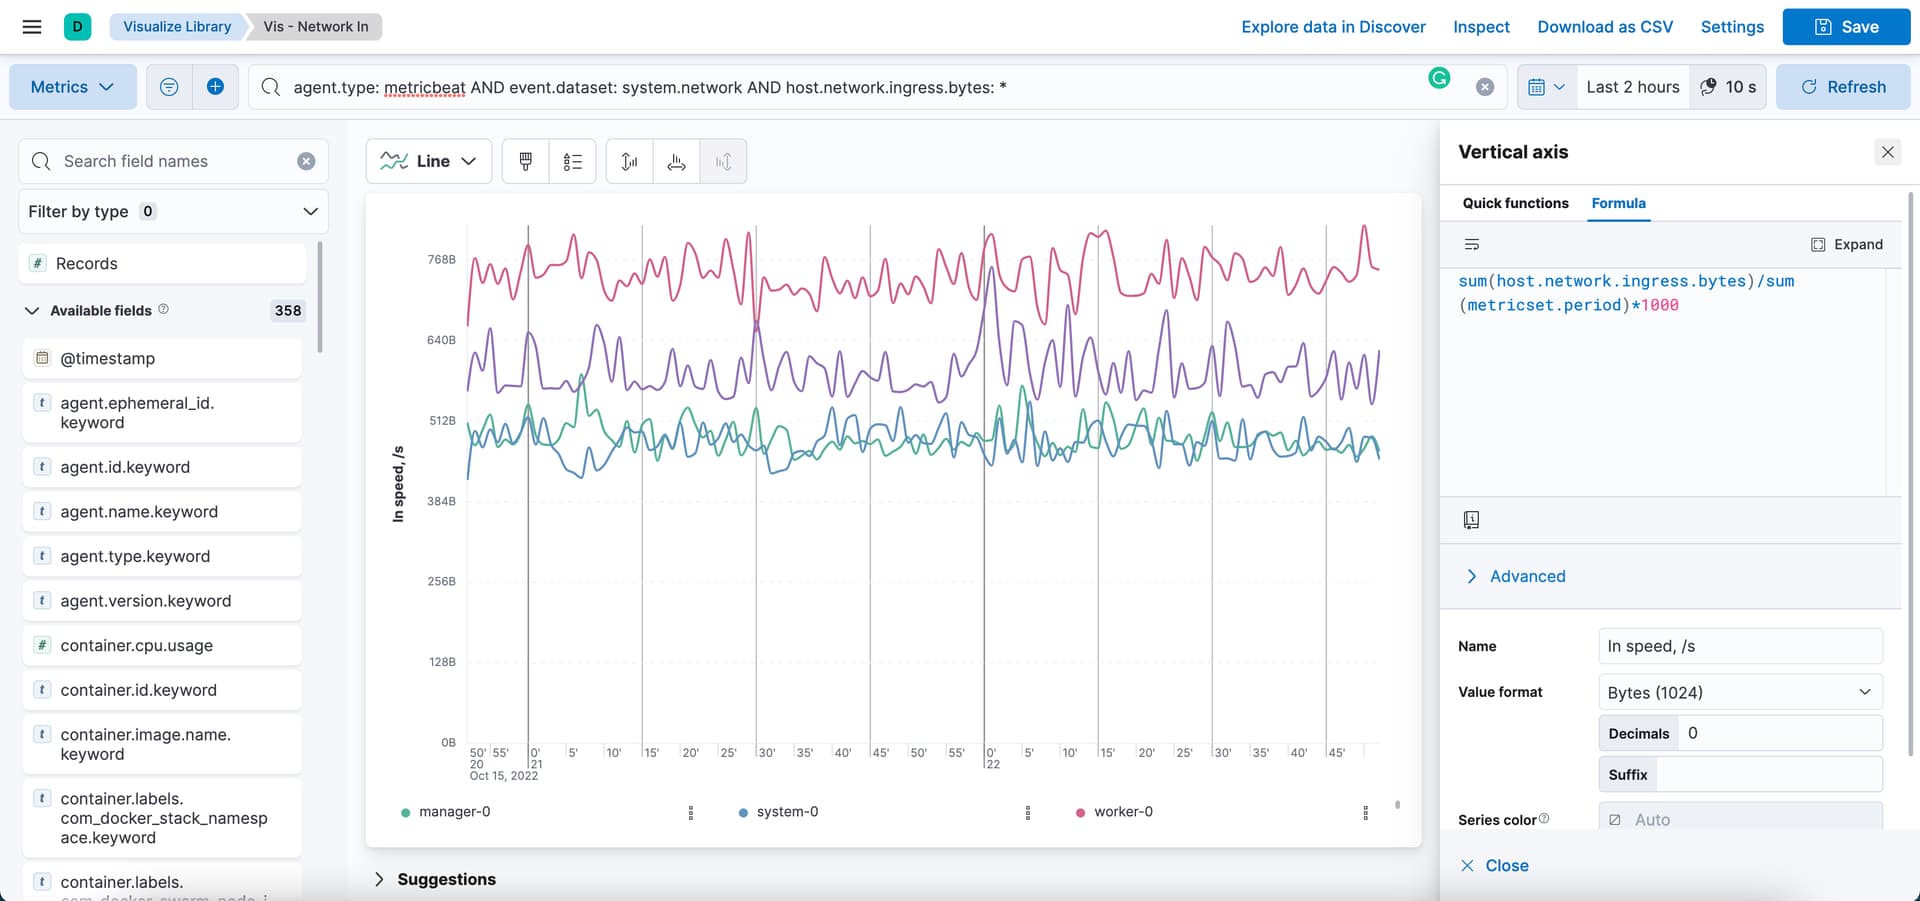
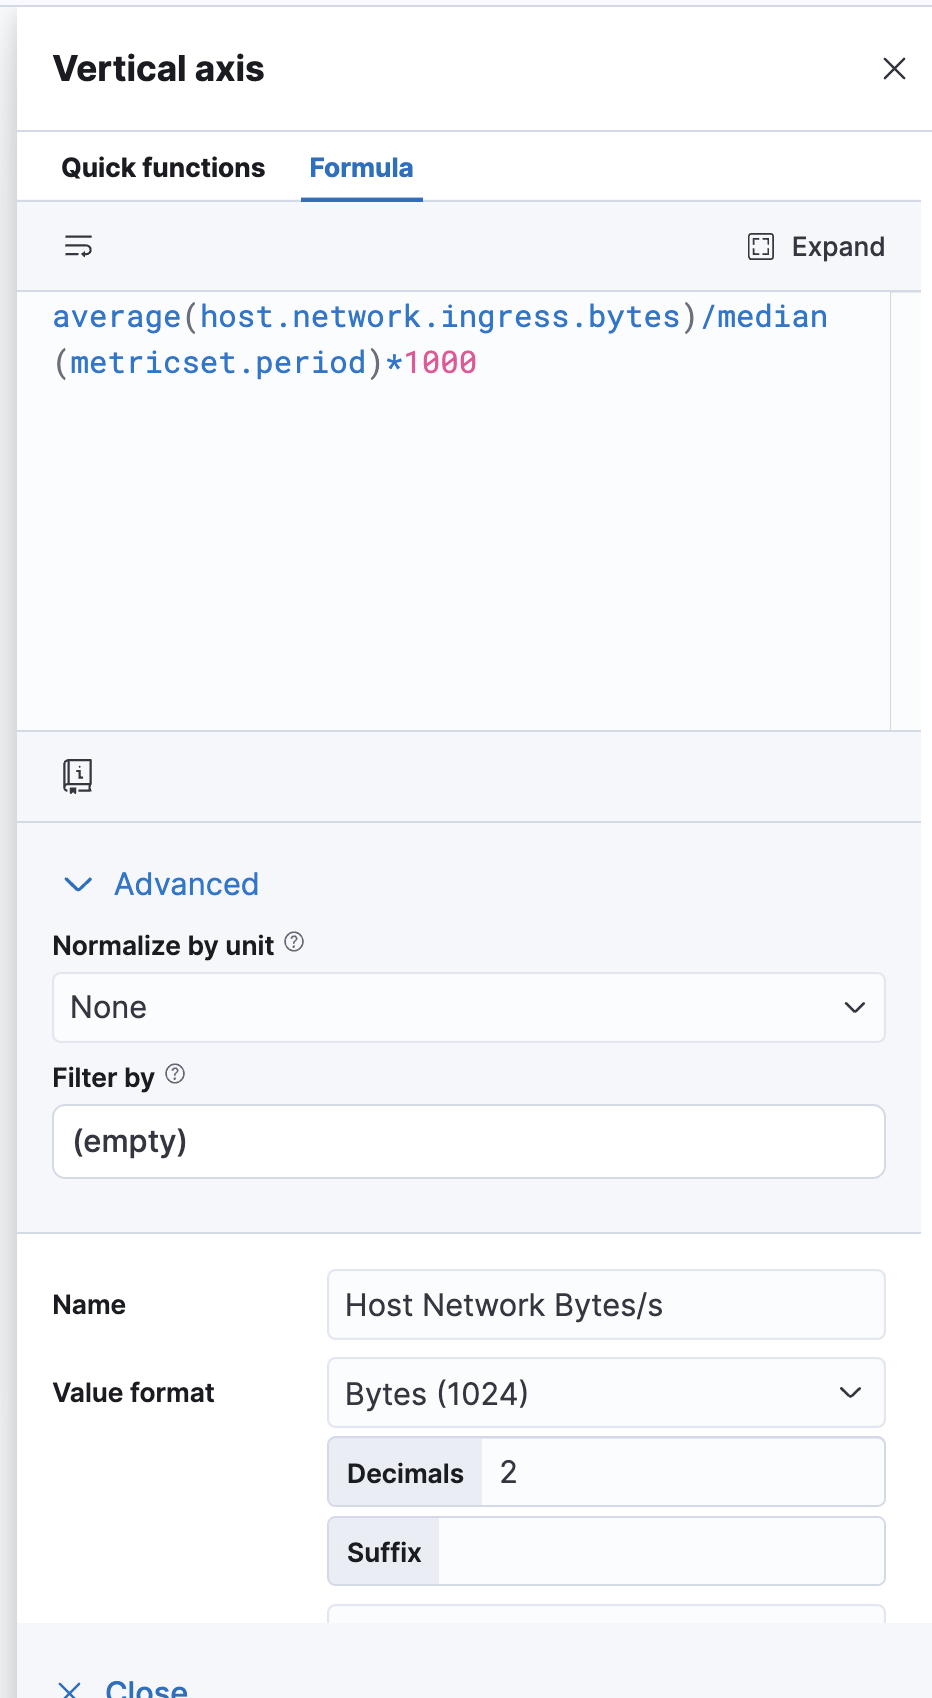
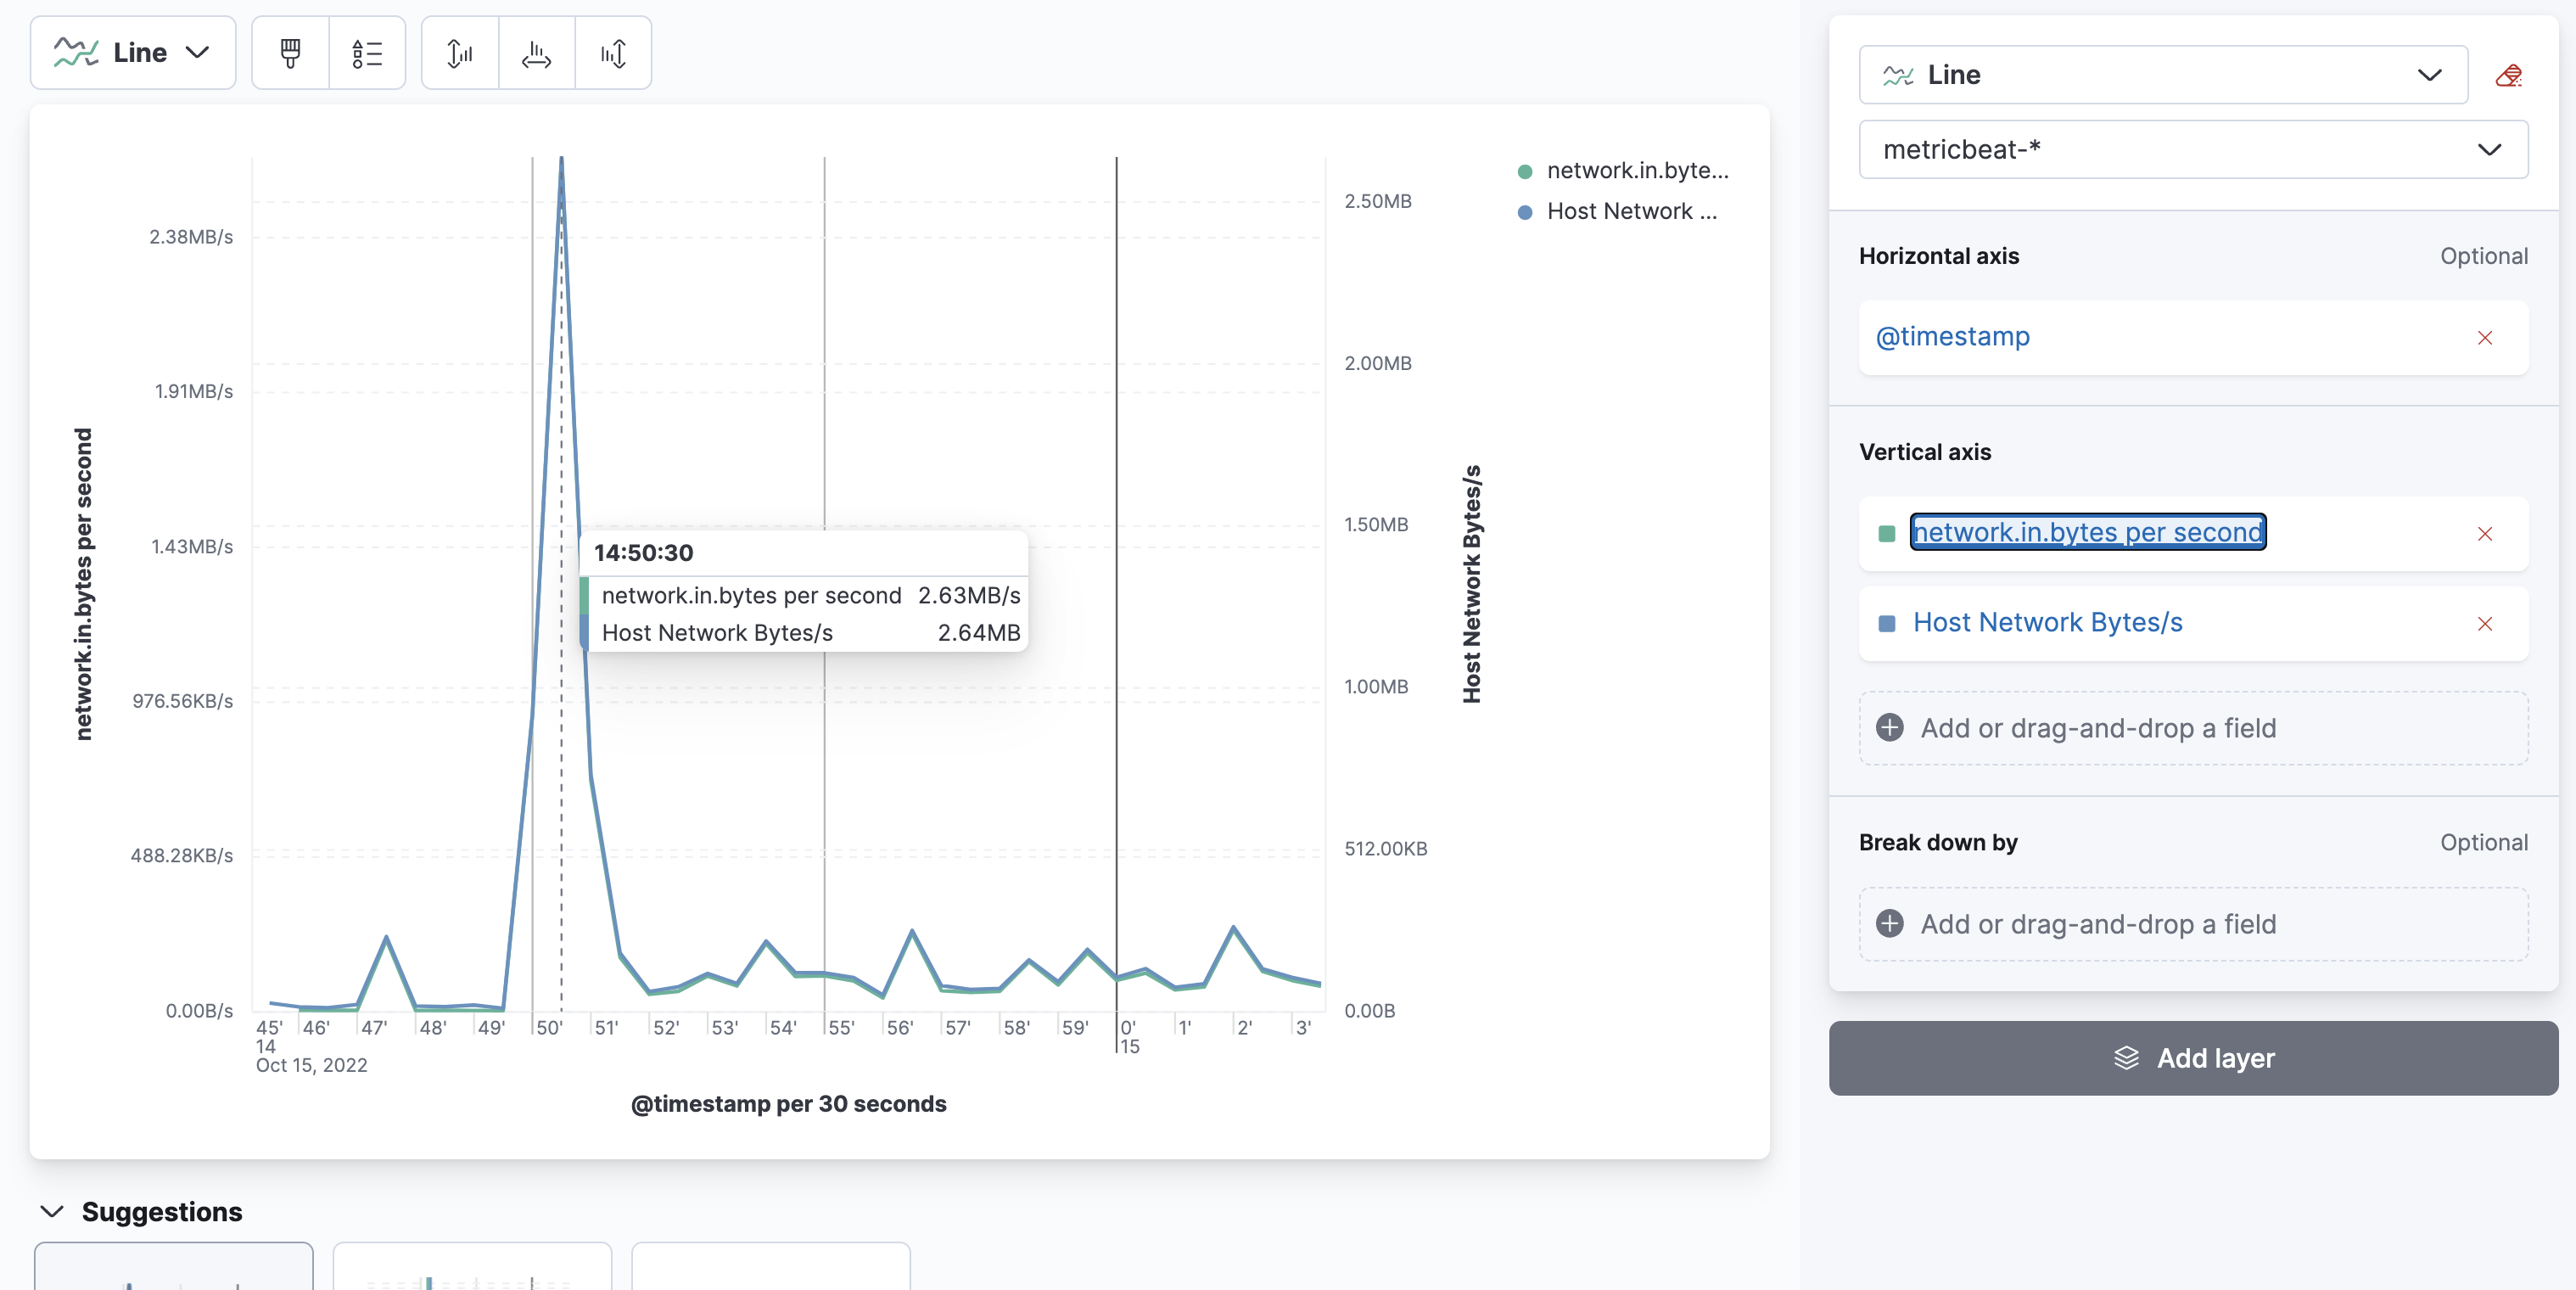
I have created visualization for the network speed and it also near the same:

Is this some misconfiguration? How can I show the real network in and out speed?

Hi @Its_Anton I am thinking that field is a counter so perhaps try counter_rate and then normalize by the units per minute or second.

Take a look at that. See if that makes sense.

Also, be careful what you're breaking that down by.

Hi, @stephenb!
Thanks for the reply.

If it would be a counter, it would increase over time, especially when I start downloading big files. But that doesn't happen.

BTW other counter fields, like docker.network.inbound.bytes work as expected, they start increase over time when I start downloading/uploading.

Try the network fields I know those work.

system.network.out.bytes
system.network.in.bytes

Be careful because that's also per network interface if I remember

If I get a chance I'll look at the host fields later.

Yeah it says it's a host fields are per period ... Interesting

Ok I checked and I see equal...

In Lens

counter_rate(max(system.network.in.bytes), kql='')
normalized per second
Format Bytes

and

average(host.network.ingress.bytes)/median(metricset.period)*1000
not Normalized
Format Bytes

Tracking / Same... very minor differences probably how they are collected.

This topic was automatically closed 28 days after the last reply. New replies are no longer allowed.