I have tried to test the load with JMeter using the following configuration:
Thread Group:
Threads (users): 100
Ramp-up time: 1 second
Loop: Infinity
Duration: 300 seconds

Additionally, I have added to that Precise Throughput Timer :
Add > Timer > Precise Throughput Timer with batch default setting of 1.
So, the total requests (threads) I want are 30,000 in 300 seconds.

Summary Report:

When I run this test on my server, I receive approximately 30,014 samples with a success rate and 0% error rate, but the GUI test shows a 99.5/sec throughput in the JMeter result summary.
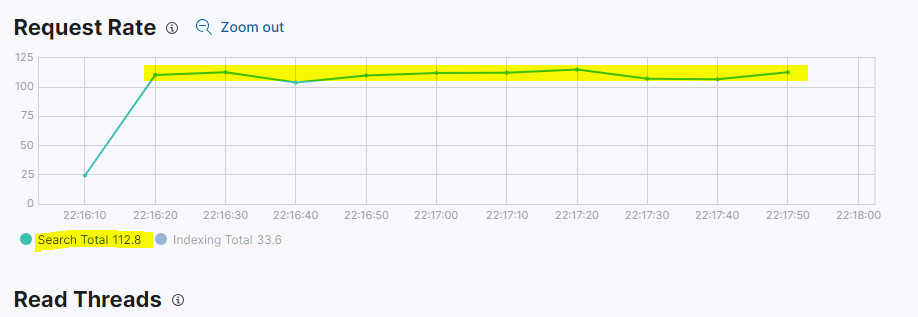
However, when I check the Elasticsearch monitoring, I see only 112 requests per 10-second interval, according to the hovering information. This makes me unclear about the actual number of requests per second being handled according to Elasticsearch monitoring.
According to JMeter, it should show 6,000 requests per 10 seconds, but it's showing me a maximum of 99.5/sec, which is confusing. I would expect a per-second chart, but it's giving me a 10-second interval.
Can someone explain this discrepancy?

It should show 1,000/10s according to the JMeter calculation, but on my custom dashboard with a 10-second interval, I'm seeing a different result.
but when i applying same on my custom dashboard with 10s then i am having like *10 .
As far as I know, these values are being calculated using counter_rate, but it's also dividing by the interval, right?
Elastic Stack Elasticsearch elastic-stack-monitoring #monitoring Elasticsearch


