Hi,
I'd like to create a vertical bar style visualization that will present data as follow
data example:
{
name: flow_
runtime:
}
I'd like to know the deveation of the last runtime value from the selected time range median of the runtime for each flow.
In my mind I imagine a graph showing the top 10 flows with the largest deveation
each flow will have 2 columns, one for the latest and the second for the median
How do you know in your data what the last runtime value was? Do the documents have a time field you can use to sort the runtime values in chronological order?
If I'm thinking along the right lines, then the vertical bar chart x-axis will have a date histogram aggregation of that time field.
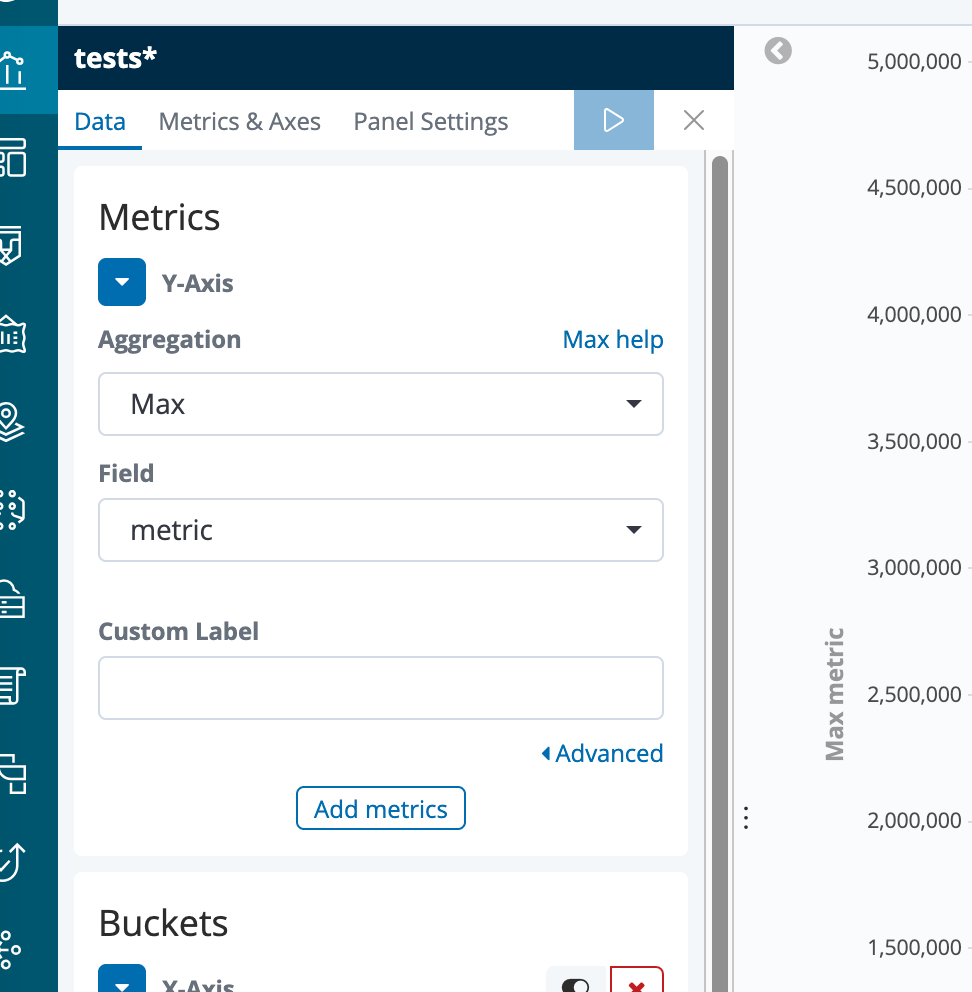
To show the value of the max metric in each bar, you'd have a Y-Axis metric of max of runtime (in my data, the field was called metric).
You can play with the "Metrics & Axes" controls to have one of the metrics show as a bar chart, another show as a line chart. You should probably also have a left and a right Y-Axis. A Y-Axis for each metric:
Apache, Apache Lucene, Apache Hadoop, Hadoop, HDFS and the yellow elephant
logo are trademarks of the
Apache Software Foundation
in the United States and/or other countries.