Please tell me how to Create a Graph using log file timestamp instead of Kibana time option.
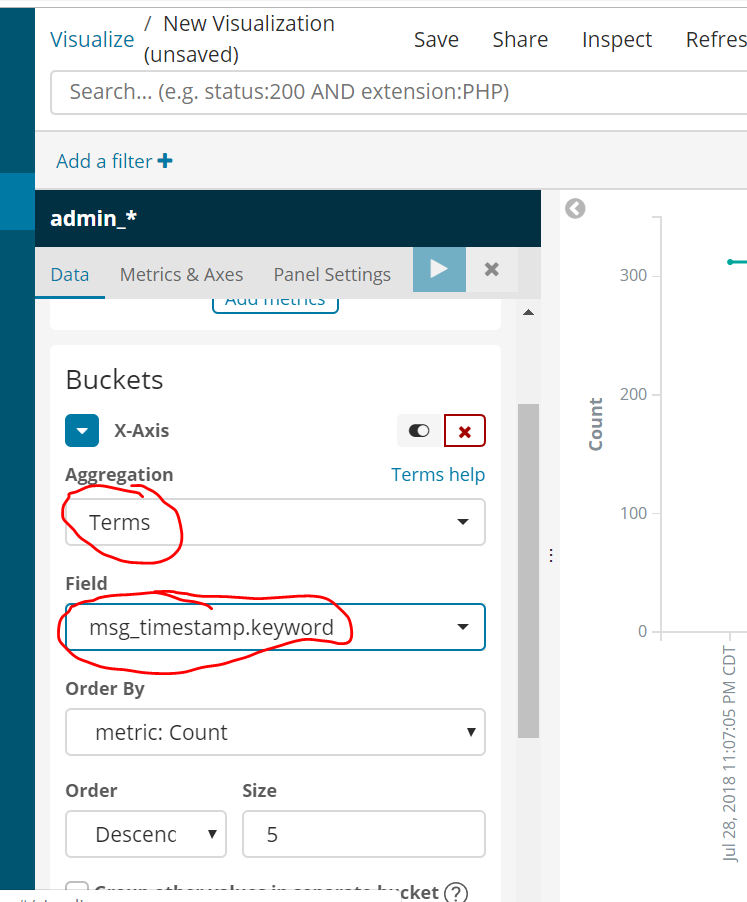
Like in below screenshot named "image 1", I want to use logfile timestamp instead of "date histogram" in aggregation.
When I am choosing the Term keyword in aggregation that time I am not able to choose the "interval" option like daily basis/hourly basis etc, as showin in screenshot image 2.
Please advise what are the option to make the graph.
this approach as you printscreen would also work but it will show only 5 values (see SIZE 5) you could update it. But since it is not date type it will not be sorted as date but as string .
Please share your logstash conf in order to fix it.
I suppose you should use date function some of this example
in case target is not defined it automatically targets it @timestamp
input {
file { #some file or directory conf
}}
filter {
#Example1
date {
match => ["msg_timestamp", "UNIX_MS"]
timezone => "Etc/UTC"
target => "msgtime"
remove_field => ["timestamp"]
}
#example2
date {
match => ["msg_timestamp", "ISO8601"]
target => "msg_timestamp"
}
#example 3
date {
match => ["msg_timestamp", "YYYYMMddHHmmss"]
timezone => "Etc/UTC"
}
#example 4
date {
match => ["msg_timestamp", "YYYYMMddHHmmss"]
timezone => "Etc/UTC"
target => "msg_timestamp"
}
}
as per your advise i tried to create one template as shown below:
after creation of this template i am facing the errors and even after deletion of this template still not working for me and even while creating the "Create index pattern" in kibana dashboard still i am getting the field named "created_at"
Create Template command:
[2018-12-06T11:07:36,948][WARN ][logstash.outputs.elasticsearch] Could not index event to Elasticsearch. {:status=>400, :action=>["index", {:_id=>nil, :_index=>"admin_filebeat-2018.12.06", :_type=>"doc", :_routing=>nil}, #LogStash::Event:0x59ec1d48], :response=>{"index"=>{"_index"=>"admin_filebeat-2018.12.06", "_type"=>"doc", "_id"=>"exIFgmcBLCbRLhh1fER2", "status"=>400, "error"=>{"type"=>"illegal_argument_exception", "reason"=>"Rejecting mapping update to [admin_filebeat-2018.12.06] as the final mapping would have more than 1 type: [_doc, doc]"}}}}
I doubt that your match is working as that pattern is unusual with everything strung together. "YYYYMMddHHmmss"
Regardless, an issue you have is multiple mapping types. You have to fix that first. Just delete your index and you should be fine, and re-index your data. logstash uses "doc" and your mapping uses "_doc."
Hello Sanchit. "_doc" is what you posted earlier in your reply. Your conflicting doc types was the first error you were receiving. It is in the error you posted. Now that you have deleted your index, the next time you ingest data, it should bring in the data, and not have errors. The next step is to then start working on your date ingestion issue. Petr gave some excellent examples of how dates can be processed to match a pattern, and then ingest that field as a data type of date. Once you achieve that, then you should be able to do the queries that you want to.
Apache, Apache Lucene, Apache Hadoop, Hadoop, HDFS and the yellow elephant
logo are trademarks of the
Apache Software Foundation
in the United States and/or other countries.