How to get the sum in time of values in Lens

You can just copy the existing filebeat template and start from there it is pretty complete... or just use it as is... and change a few items like the index pattern matching ... and the write alias / ILM if you want to use them.

Also this is the first time you mentioned logstash, which is fine but can add complications... not done correct it can affect the index name / results etc... (usually I suggest getting filebeat -> elasticsearch first before adding logstash)

Not sure what you mean

That is correct, if you were on a newer version you could use a runtime field to "emit" a new field with the type you like.

You can also reindex the data if you like into a new index with the proper mappings.

It looks like the mapping was not applied... did you have the correct index pattern matching?

"index_patterns": ["foo*", "bar*"],

I don't know what that means... pre-determine how... based on what?... the host it is being collected from or from some data inside the actual log message...

Soooo here is my suggestion and it is just that...
It looks like you are 7.10... so this is 7.x suggestions (will change some in 8.x). Use the module AND get what you want too!

  1. prefix your indices with filebeat- and the filebeat index template will apply for free so you don't need to worry about all that template and mapping stuff :slight_smile: You will get it all for free... the pipelines, data types will be applied and everything.... funny the default dashboards should work too! then you can just add a control for customer-a vs customer-b

  2. You are right... with modules it is very hard and very easy at the same time... we will set these in the ngnix.yml. Modules set a lot of setting that overide the out put settings see here. So you can set any of those normal input setting with the prefix input. see here and here You can add any filestream input setting...

That input.index setting will be carried through to the output.. now you can name it what every you like... ohh and where this is not set it will use the normal output so you don't need that conditional stuff in the output.

You could add your customer name in the index too... and create and matching index patter to just see them.

This sample I just added a tag

- module: nginx
  # Access logs
  access:
    enabled: true
    input.index: "filebeat-%{[agent.version]}-nginx-access-%{+yyyy.MM.dd}"
    # Add customer tag if you like
    input.tags: ["customer-a"]

    # Set custom paths for the log files. If left empty,
    # Filebeat will choose the paths depending on your OS.
    var.paths: ["/Users/sbrown/workspace/sample-data/nginx/nginx-test.log"]

Walluhh!!! Now this is daily indexes not ILM based etc.. etc. .but should get you started...

GET _cat/indices/*
green  open .kibana_task_manager_7.17.3_001         IohOxEOERYqR3ItEkebzCQ 1 0   17 1212 179.5kb 179.5kb
yellow open filebeat-7.17.3-nginx-access-2022.08.01 mFRSgBlHTfCap7a63LntYQ 1 1    9    0  43.6kb  43.6kb

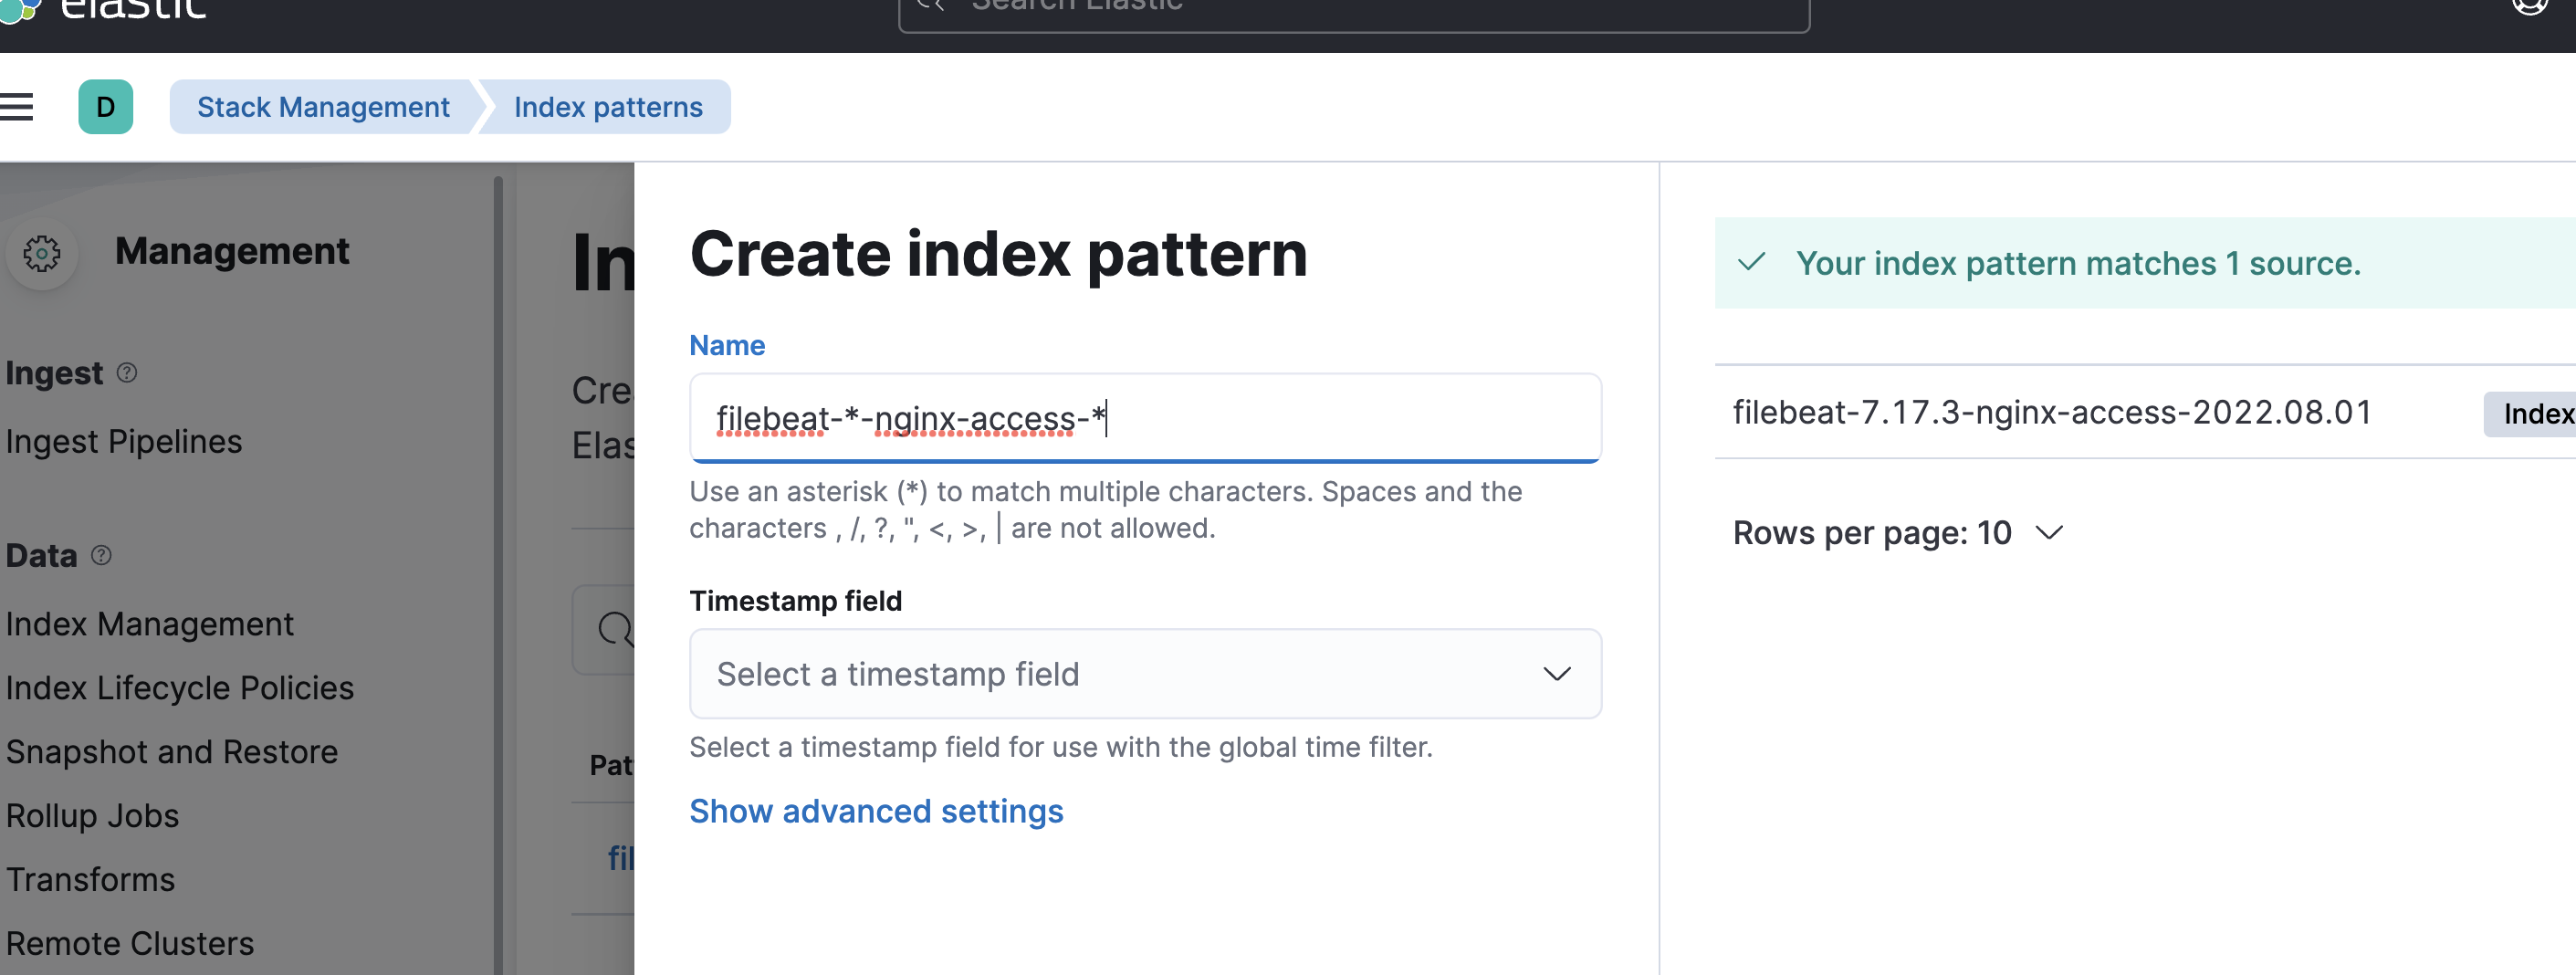
Now you can set up an index pattern like this and everything should work
You can add the customer name in all this too if you want...

And the data types are correct!!!

Thanks for answering.
Your suggestion is very appealing.
However, I am not getting the expected result: input.index is not behaving well.

I have made the following statements in filebeat.yml and nginx.yml.

# vi /etc/filebeat/filebeat.yml

filebeat.config.modules:
   path: /etc/filebeat/modules.d/*.yml
output.elasticsearch:
   hosts: ["localhost:9200"].
# vi /etc/filebeat/modules.d/nginx.yml

- module: nginx
  # access logs
  access:
    enabled: true
    var.paths: ["/var/log/nginx/access.log"].
    input.index: "filebeat-else02-httpd-access-%{+yyyy.MM.dd}"

  # Error logs
  error:
    enabled: true
    var.paths: ["/var/log/nginx/error.log"]]
    input.index: "filebeat-else02-httpd-error-%{+yyyy.MM.dd}"

Restarting Filebeat yields the following result.

# curl -X GET "localhost:9200/_cat/indices?v"
health status index index uuid pri rep docs.count docs.deleted store.size pri.store.size
... snip ...
green open filebeat-else02-httpd-access-2022.08.02 MhfoSGBnRt-Kenui4hzI4Q 1 0 0 0 208b 208b
yellow open filebeat-7.12.0-2022.08.02-000001 6LiS2pIER0etyxqqL-Y3wQ 1 1 422802 0 289.9mb 289.9mb
... snip ...

Thanks to input.index, we have created an index with the given name.
However, the document is not added to that index, but to the default filebeat-7.12.0-2022.08.02-000001.

I would like the document to be added to the index with the specified name.

What action is needed?

Hmmmm can you share your entire filebeat.yml please are there any other inputs or modules you are using?

You need to put the version in as part of the name filebeat-7.12.0-* that version number is part of the matching pattern for the template... it sorta / looks like it works without the version but it is not leveraging the template which we want because you may not get all the correct types, which is what started this whole thread.

input.index: "filebeat-%{[agent.version]}-else02-httpd-access-%{+yyyy.MM.dd}"

Why its going into the normal not sure...

Cleanup both indices (I gather you know who to rerun a file by deleting the filebeat/data dir)

I just ran mine again worked as expected .... put the version in but I do not think that is the real issues there is something else going on I need to see all the configs...

Here is my entire filebeeat.yml ... not a snippet

filebeat.config.modules:
  path: ${path.config}/modules.d/*.yml
  reload.enabled: false

setup.template.settings:
  index.number_of_shards: 1

setup.kibana:

output.elasticsearch:
  hosts: ["localhost:9200"]

and my entire nginx.yml

- module: nginx
  # Access logs
  access:
    enabled: true
    input.index: "filebeat-%{[agent.version]}-nginx-access-%{+yyyy.MM.dd}"
    input.tags: ["customer-a"]

    # Set custom paths for the log files. If left empty,
    # Filebeat will choose the paths depending on your OS.
    var.paths: ["/Users/sbrown/workspace/sample-data/nginx/nginx-test.log"]
  

I DELETE the indices
from the filebeat directory

sbrown$ rm -fr data
sbrown$ ./filebeat setup -e
sbrown$ ./filebeat -e

And get these results. I am running on 7.17.3 that should not make a difference if there is still an issue tomorrow I will run in on 7.12.0

health status index                                   uuid                   pri rep docs.count docs.deleted store.size pri.store.size
yellow open   filebeat-7.17.3-nginx-access-2022.08.01 JrPXBmDXR4GKPxXX8UVk6Q   1   1          7            0       226b           226b
yellow open   filebeat-7.17.3-2022.08.02-000001       cBjEWHa8RkSzLyghiKl4CQ   1   1          0            0       226b           226b

Share the entire filebeat.yml.

 ###################### Filebeat Configuration Example #########################

 # This file is an example configuration file highlighting only the most common
 # options. The filebeat.reference.yml file from the same directory contains all the
 # supported options with more comments. You can use it as a reference.
 #
 # You can find the full configuration reference here:
 # https://www.elastic.co/guide/en/beats/filebeat/index.html

 # For more available modules and options, please see the filebeat.reference.yml sample
 # configuration file.

 # ============================== Filebeat inputs ===============================

 filebeat.inputs:

 # Each - is an input. Most options can be set at the input level, so
 # you can use different inputs for various configurations.
 # Below are the input specific configurations.

 #- type: log
 #  enabled: true
 #  paths:
 #    - /var/log/test.log
 #  fields:
 #    index_name: else02-test

 - type: log

   # Change to true to enable this input configuration.
   enabled: false

   # Paths that should be crawled and fetched. Glob based paths.
   paths:
     - /var/log/*.log
     #- c:\programdata\elasticsearch\logs\*

   # Exclude lines. A list of regular expressions to match. It drops the lines that are
   # matching any regular expression from the list.
   #exclude_lines: ['^DBG']

   # Include lines. A list of regular expressions to match. It exports the lines that are
   # matching any regular expression from the list.
   #include_lines: ['^ERR', '^WARN']

   # Exclude files. A list of regular expressions to match. Filebeat drops the files that
   # are matching any regular expression from the list. By default, no files are dropped.
   #exclude_files: ['.gz$']

   # Optional additional fields. These fields can be freely picked
   # to add additional information to the crawled log files for filtering
   #fields:
   #  level: debug
   #  review: 1

   ### Multiline options

   # Multiline can be used for log messages spanning multiple lines. This is common
   # for Java Stack Traces or C-Line Continuation

   # The regexp Pattern that has to be matched. The example pattern matches all lines starting with [
   #multiline.pattern: ^\[

   # Defines if the pattern set under pattern should be negated or not. Default is false.
   #multiline.negate: false

   # Match can be set to "after" or "before". It is used to define if lines should be append to a pattern
   # that was (not) matched before or after or as long as a pattern is not matched based on negate.
   # Note: After is the equivalent to previous and before is the equivalent to to next in Logstash
   #multiline.match: after

 # filestream is an experimental input. It is going to replace log input in the future.
 - type: filestream

   # Change to true to enable this input configuration.
   enabled: false

   # Paths that should be crawled and fetched. Glob based paths.
   paths:
     - /var/log/*.log
     #- c:\programdata\elasticsearch\logs\*

   # Exclude lines. A list of regular expressions to match. It drops the lines that are
   # matching any regular expression from the list.
   #exclude_lines: ['^DBG']

   # Include lines. A list of regular expressions to match. It exports the lines that are
   # matching any regular expression from the list.
   #include_lines: ['^ERR', '^WARN']

   # Exclude files. A list of regular expressions to match. Filebeat drops the files that
   # are matching any regular expression from the list. By default, no files are dropped.
   #prospector.scanner.exclude_files: ['.gz$']

   # Optional additional fields. These fields can be freely picked
   # to add additional information to the crawled log files for filtering
   #fields:
   #  level: debug
   #  review: 1

 # ============================== Filebeat modules ==============================

 filebeat.config.modules:
   # Glob pattern for configuration loading
   #path: ${path.config}/modules.d/*.yml
   path: /etc/filebeat/modules.d/*.yml

   # Set to true to enable config reloading
   #reload.enabled: false

   # Period on which files under path should be checked for changes
   #reload.period: 10s

 # ======================= Elasticsearch template setting =======================

 setup.template.settings:
   index.number_of_shards: 1
   index.number_of_replica: 0
   #index.codec: best_compression
   #_source.enabled: false


 # ================================== General ===================================

 # The name of the shipper that publishes the network data. It can be used to group
 # all the transactions sent by a single shipper in the web interface.
 #name:

 # The tags of the shipper are included in their own field with each
 # transaction published.
 #tags: ["service-X", "web-tier"]

 # Optional fields that you can specify to add additional information to the
 # output.
 #fields:
 #  env: staging

 # ================================= Dashboards =================================
 # These settings control loading the sample dashboards to the Kibana index. Loading
 # the dashboards is disabled by default and can be enabled either by setting the
 # options here or by using the `setup` command.
 #setup.dashboards.enabled: false

 # The URL from where to download the dashboards archive. By default this URL
 # has a value which is computed based on the Beat name and version. For released
 # versions, this URL points to the dashboard archive on the artifacts.elastic.co
 # website.
 #setup.dashboards.url:

 # =================================== Kibana ===================================

 # Starting with Beats version 6.0.0, the dashboards are loaded via the Kibana API.
 # This requires a Kibana endpoint configuration.
 setup.kibana:

   # Kibana Host
   # Scheme and port can be left out and will be set to the default (http and 5601)
   # In case you specify and additional path, the scheme is required: http://localhost:5601/path
   # IPv6 addresses should always be defined as: https://[2001:db8::1]:5601
   #host: "localhost:5601"

   # Kibana Space ID
   # ID of the Kibana Space into which the dashboards should be loaded. By default,
   # the Default Space will be used.
   #space.id:

 # =============================== Elastic Cloud ================================

 # These settings simplify using Filebeat with the Elastic Cloud (https://cloud.elastic.co/).

 # The cloud.id setting overwrites the `output.elasticsearch.hosts` and
 # `setup.kibana.host` options.
 # You can find the `cloud.id` in the Elastic Cloud web UI.
 #cloud.id:

 # The cloud.auth setting overwrites the `output.elasticsearch.username` and
 # `output.elasticsearch.password` settings. The format is `<user>:<pass>`.
 #cloud.auth:

 # ================================== Outputs ===================================

 # Configure what output to use when sending the data collected by the beat.

 # ---------------------------- Elasticsearch Output ----------------------------
 output.elasticsearch:
   #fields:
   #  level: debug
   #  review: 1

   ### Multiline options

   # Multiline can be used for log messages spanning multiple lines. This is common
   # for Java Stack Traces or C-Line Continuation

   # The regexp Pattern that has to be matched. The example pattern matches all lines starting with [
   #multiline.pattern: ^\[

   # Defines if the pattern set under pattern should be negated or not. Default is false.
   #multiline.negate: false

   # Match can be set to "after" or "before". It is used to define if lines should be append to a pattern
   # that was (not) matched before or after or as long as a pattern is not matched based on negate.
   # Note: After is the equivalent to previous and before is the equivalent to to next in Logstash
   #multiline.match: after

 # filestream is an experimental input. It is going to replace log input in the future.
 - type: filestream


   # Exclude files. A list of regular expressions to match. Filebeat drops the files that
   # are matching any regular expression from the list. By default, no files are dropped.
   #prospector.scanner.exclude_files: ['.gz$']

   # Optional additional fields. These fields can be freely picked
   # to add additional information to the crawled log files for filtering
   #fields:
   #  level: debug
   #  review: 1

 # ============================== Filebeat modules ==============================

 filebeat.config.modules:
   # Glob pattern for configuration loading
   #path: ${path.config}/modules.d/*.yml
   path: /etc/filebeat/modules.d/*.yml

   # Set to true to enable config reloading
   #reload.enabled: false

   # Period on which files under path should be checked for changes
   #reload.period: 10s

 # ======================= Elasticsearch template setting =======================

 setup.template.settings:
   index.number_of_shards: 1
   index.number_of_replica: 0
   #index.codec: best_compression
   #_source.enabled: false


 # ================================== General ===================================

 # The name of the shipper that publishes the network data. It can be used to group
 # all the transactions sent by a single shipper in the web interface.
 #name:

 # The tags of the shipper are included in their own field with each
 # transaction published.
 #tags: ["service-X", "web-tier"]

 # Optional fields that you can specify to add additional information to the
 # output.
 #fields:
 #  env: staging

 # ================================= Dashboards =================================
 # These settings control loading the sample dashboards to the Kibana index. Loading
 # the dashboards is disabled by default and can be enabled either by setting the
 # options here or by using the `setup` command.
 #setup.dashboards.enabled: false

 # The URL from where to download the dashboards archive. By default this URL
 # has a value which is computed based on the Beat name and version. For released
 # versions, this URL points to the dashboard archive on the artifacts.elastic.co
 # website.
 #setup.dashboards.url:

 # =================================== Kibana ===================================

 # Starting with Beats version 6.0.0, the dashboards are loaded via the Kibana API.
 # This requires a Kibana endpoint configuration.
 setup.kibana:

   # Kibana Host
   # Scheme and port can be left out and will be set to the default (http and 5601)
   # In case you specify and additional path, the scheme is required: http://localhost:5601/path
   # IPv6 addresses should always be defined as: https://[2001:db8::1]:5601
   #host: "localhost:5601"

   # Kibana Space ID
   # ID of the Kibana Space into which the dashboards should be loaded. By default,
   # the Default Space will be used.
   #space.id:

 # =============================== Elastic Cloud ================================

 # These settings simplify using Filebeat with the Elastic Cloud (https://cloud.elastic.co/).

 # The cloud.id setting overwrites the `output.elasticsearch.hosts` and
 # `setup.kibana.host` options.
 # You can find the `cloud.id` in the Elastic Cloud web UI.
 #cloud.id:

 # The cloud.auth setting overwrites the `output.elasticsearch.username` and
 # `output.elasticsearch.password` settings. The format is `<user>:<pass>`.
 #cloud.auth:

 # ================================== Outputs ===================================

 # Configure what output to use when sending the data collected by the beat.

 ###################### Filebeat Configuration Example #########################

 # This file is an example configuration file highlighting only the most common
 # options. The filebeat.reference.yml file from the same directory contains all the
 # supported options with more comments. You can use it as a reference.
 #
 # You can find the full configuration reference here:
 # https://www.elastic.co/guide/en/beats/filebeat/index.html

 # For more available modules and options, please see the filebeat.reference.yml sample
 # configuration file.

 # ============================== Filebeat inputs ===============================

 filebeat.inputs:

 # Each - is an input. Most options can be set at the input level, so
 # you can use different inputs for various configurations.
 # Below are the input specific configurations.

 #- type: log
 #  enabled: true
 #  paths:
 #    - /var/log/test.log
 #  fields:
 #    index_name: else02-test

 - type: log

   # Change to true to enable this input configuration.
   enabled: false

   # Paths that should be crawled and fetched. Glob based paths.
   paths:
     - /var/log/*.log
     #- c:\programdata\elasticsearch\logs\*

   # Exclude lines. A list of regular expressions to match. It drops the lines that are
   # matching any regular expression from the list.
   #exclude_lines: ['^DBG']

   # Include lines. A list of regular expressions to match. It exports the lines that are
   # matching any regular expression from the list.
   #include_lines: ['^ERR', '^WARN']

   # Exclude files. A list of regular expressions to match. Filebeat drops the files that
   # are matching any regular expression from the list. By default, no files are dropped.
   #exclude_files: ['.gz$']

   # Optional additional fields. These fields can be freely picked
   # to add additional information to the crawled log files for filtering
   #fields:
   #  level: debug
   #  review: 1

   ### Multiline options

   # Multiline can be used for log messages spanning multiple lines. This is common
   # for Java Stack Traces or C-Line Continuation

   # The regexp Pattern that has to be matched. The example pattern matches all lines starting with [
   #multiline.pattern: ^\[

   # Defines if the pattern set under pattern should be negated or not. Default is false.
   #multiline.negate: false

   # Match can be set to "after" or "before". It is used to define if lines should be append to a pattern
   # that was (not) matched before or after or as long as a pattern is not matched based on negate.
   # Note: After is the equivalent to previous and before is the equivalent to to next in Logstash
   #multiline.match: after

 # filestream is an experimental input. It is going to replace log input in the future.
 - type: filestream

   # Change to true to enable this input configuration.
   enabled: false

   # Paths that should be crawled and fetched. Glob based paths.
   paths:
     - /var/log/*.log
     #- c:\programdata\elasticsearch\logs\*

   # Exclude lines. A list of regular expressions to match. It drops the lines that are
   # matching any regular expression from the list.
   #exclude_lines: ['^DBG']

   # Include lines. A list of regular expressions to match. It exports the lines that are
   # matching any regular expression from the list.
   #include_lines: ['^ERR', '^WARN']

   # Exclude files. A list of regular expressions to match. Filebeat drops the files that
   # are matching any regular expression from the list. By default, no files are dropped.
   #prospector.scanner.exclude_files: ['.gz$']

   # Optional additional fields. These fields can be freely picked
   # to add additional information to the crawled log files for filtering
   #fields:
   #  level: debug
   #  review: 1

 # ============================== Filebeat modules ==============================

 filebeat.config.modules:
   # Glob pattern for configuration loading
   #path: ${path.config}/modules.d/*.yml
   path: /etc/filebeat/modules.d/*.yml

   # Set to true to enable config reloading
   #reload.enabled: false

   # Period on which files under path should be checked for changes
   #reload.period: 10s

 # ======================= Elasticsearch template setting =======================

 setup.template.settings:
   index.number_of_shards: 1
   index.number_of_replica: 0
   #index.codec: best_compression
   #_source.enabled: false


 # ================================== General ===================================

 # The name of the shipper that publishes the network data. It can be used to group
 # all the transactions sent by a single shipper in the web interface.
 #name:

 # The tags of the shipper are included in their own field with each
 # transaction published.
 #tags: ["service-X", "web-tier"]

 # Optional fields that you can specify to add additional information to the
 # output.
 #fields:
 #  env: staging

 # ================================= Dashboards =================================
 # These settings control loading the sample dashboards to the Kibana index. Loading
 # the dashboards is disabled by default and can be enabled either by setting the
 # options here or by using the `setup` command.
 #setup.dashboards.enabled: false

 # The URL from where to download the dashboards archive. By default this URL
 # has a value which is computed based on the Beat name and version. For released
 # versions, this URL points to the dashboard archive on the artifacts.elastic.co
 # website.
 #setup.dashboards.url:

 # =================================== Kibana ===================================

 # Starting with Beats version 6.0.0, the dashboards are loaded via the Kibana API.
 # This requires a Kibana endpoint configuration.
 setup.kibana:

   # Kibana Host
   # Scheme and port can be left out and will be set to the default (http and 5601)
   # In case you specify and additional path, the scheme is required: http://localhost:5601/path
   # IPv6 addresses should always be defined as: https://[2001:db8::1]:5601
   #host: "localhost:5601"

   # Kibana Space ID
   # ID of the Kibana Space into which the dashboards should be loaded. By default,
   # the Default Space will be used.
   #space.id:

 # =============================== Elastic Cloud ================================

 # These settings simplify using Filebeat with the Elastic Cloud (https://cloud.elastic.co/).

 # The cloud.id setting overwrites the `output.elasticsearch.hosts` and
 # `setup.kibana.host` options.
 # You can find the `cloud.id` in the Elastic Cloud web UI.
 #cloud.id:

 # The cloud.auth setting overwrites the `output.elasticsearch.username` and
 # `output.elasticsearch.password` settings. The format is `<user>:<pass>`.
 #cloud.auth:

 # ================================== Outputs ===================================

 # Configure what output to use when sending the data collected by the beat.

 # ---------------------------- Elasticsearch Output ----------------------------
 output.elasticsearch:
   # Array of hosts to connect to.
   hosts: ["localhost:9200"]
   #indices:
   #  - index: "else-httpd-access-%{+yyyy.MM.dd}"
   #    when.equals:
   #      event.module: "nginx"
   #  - default: "filebeat-%{[agent.version]}-%{+yyyy.MM.dd}"

   # Protocol - either `http` (default) or `https`.
   #protocol: "https"

   # Authentication credentials - either API key or username/password.
   #api_key: "id:api_key"
   #username: "elastic"
   #password: "changeme"

 # ------------------------------ Logstash Output -------------------------------
 #output.logstash:
   # The Logstash hosts
   #hosts: ["localhost:5044"]

   # Optional SSL. By default is off.
   # List of root certificates for HTTPS server verifications
   #ssl.certificate_authorities: ["/etc/pki/root/ca.pem"]

   # Certificate for SSL client authentication
   #ssl.certificate: "/etc/pki/client/cert.pem"

   # Client Certificate Key
   #ssl.key: "/etc/pki/client/cert.key"

 # ================================= Processors =================================
 processors:
   - add_host_metadata:
       when.not.contains.tags: forwarded
   - add_cloud_metadata: ~
   - add_docker_metadata: ~
   - add_kubernetes_metadata: ~

 # ================================== Logging ===================================

 # Sets log level. The default log level is info.
 # Available log levels are: error, warning, info, debug
 #logging.level: debug

 # At debug level, you can selectively enable logging only for some components.
 # To enable all selectors use ["*"]. Examples of other selectors are "beat",
 # "publisher", "service".
 #logging.selectors: ["*"]

 logging:
   level: info
   to_files: true
   to_syslog: false

 # ============================= X-Pack Monitoring ==============================
 # Filebeat can export internal metrics to a central Elasticsearch monitoring
 # cluster.  This requires xpack monitoring to be enabled in Elasticsearch.  The
 # reporting is disabled by default.

 # Set to true to enable the monitoring reporter.
 #monitoring.enabled: false

 # Sets the UUID of the Elasticsearch cluster under which monitoring data for this
 # Filebeat instance will appear in the Stack Monitoring UI. If output.elasticsearch
 # is enabled, the UUID is derived from the Elasticsearch cluster referenced by output.elasticsearch.
 #monitoring.cluster_uuid:

 # Uncomment to send the metrics to Elasticsearch. Most settings from the
 # Elasticsearch output are accepted here as well.
 # Note that the settings should point to your Elasticsearch *monitoring* cluster.
 # Any setting that is not set is automatically inherited from the Elasticsearch
 # output configuration, so if you have the Elasticsearch output configured such
 # that it is pointing to your Elasticsearch monitoring cluster, you can simply
 # uncomment the following line.
 #monitoring.elasticsearch:

 # ============================== Instrumentation ===============================

 # Instrumentation support for the filebeat.
 #instrumentation:
     # Set to true to enable instrumentation of filebeat.
     #enabled: false

     # Environment in which filebeat is running on (eg: staging, production, etc.)
     #environment: ""

     # APM Server hosts to report instrumentation results to.
     #hosts:
     #  - http://localhost:8200

     # API Key for the APM Server(s).
     # If api_key is set then secret_token will be ignored.
     #api_key:

     # Secret token for the APM Server(s).
     #secret_token:


 # ================================= Migration ==================================

 # This allows to enable 6.7 migration aliases
 #migration.6_to_7.enabled: true

No other input is used.
Only nginx.yml module is also enabled.

# ls /etc/filebeat/modules.d/
activemq.yml.disabled    cisco.yml.disabled          fortinet.yml.disabled          imperva.yml.disabled    mongodb.yml.disabled          o365.yml.disabled        radware.yml.disabled    system.yml
apache.yml.disabled      coredns.yml.disabled        gcp.yml.disabled               infoblox.yml.disabled   mssql.yml.disabled            okta.yml.disabled        redis.yml.disabled      system.yml.disabled
auditd.yml.disabled      crowdstrike.yml.disabled    google_workspace.yml.disabled  iptables.yml.disabled   mysql.yml.disabled            oracle.yml.disabled      santa.yml.disabled      threatintel.yml.disabled
aws.yml.disabled         cyberark.yml.disabled       googlecloud.yml.disabled       juniper.yml.disabled    mysqlenterprise.yml.disabled  osquery.yml.disabled     snort.yml.disabled      tomcat.yml.disabled
azure.yml.disabled       cylance.yml.disabled        gsuite.yml.disabled            kafka.yml.disabled      nats.yml.disabled             panw.yml.disabled        snyk.yml.disabled       traefik.yml.disabled
barracuda.yml.disabled   elasticsearch.yml           haproxy.yml.disabled           kibana.yml.disabled     netflow.yml.disabled          pensando.yml.disabled    sonicwall.yml.disabled  zeek.yml.disabled
bluecoat.yml.disabled    elasticsearch.yml.disabled  ibmmq.yml.disabled             logstash.yml.disabled   netscout.yml.disabled         postgresql.yml.disabled  sophos.yml.disabled     zoom.yml.disabled
cef.yml.disabled         envoyproxy.yml.disabled     icinga.yml.disabled            microsoft.yml.disabled  nginx.yml                     proofpoint.yml.disabled  squid.yml.disabled      zscaler.yml.disabled
checkpoint.yml.disabled  f5.yml.disabled             iis.yml.disabled               misp.yml.disabled       nginx.yml.disabled            rabbitmq.yml.disabled    suricata.yml.disabled

your filebeat.yml is strange it is like 2 appended. duplicated... try my simplified first and then go from there.

you have random stuff in there like this line I am not sure why it is working...

# filestream is an experimental input. It is going to replace log input in the future.
 - type: filestream

Hmmm. Wouldn't you agree?
That's the default setting; I haven't changed it since I installed Filebeat.

Regardless of type: filestream, if type: log also has the option enabled: false, wouldn't those settings be disabled?

Your filebeat.yml above is far from the original / normal... there a half settings ...and duplicates

Anyways that's my suggestion...try mine.. fix the path to the modules that's it...

No I don't agree.. your filebeat.yml is not correct that is far from the installed / original version..

You are missing the point that line is in your file multiple times, once with nothing below it.

I would start with mine or clean version... But that is just a suggestion...

I'm sorry. My mistake.
Please look again at the following description.

###################### Filebeat Configuration Example #########################

# This file is an example configuration file highlighting only the most common
# options. The filebeat.reference.yml file from the same directory contains all the
# supported options with more comments. You can use it as a reference.
#
# You can find the full configuration reference here:
# https://www.elastic.co/guide/en/beats/filebeat/index.html

# For more available modules and options, please see the filebeat.reference.yml sample
# configuration file.

# ============================== Filebeat inputs ===============================

filebeat.inputs:

# Each - is an input. Most options can be set at the input level, so
# you can use different inputs for various configurations.
# Below are the input specific configurations.

# filestream is an input for collecting log messages from files.
- type: filestream

  # Unique ID among all inputs, an ID is required.
  id: my-filestream-id

  # Change to true to enable this input configuration.
  enabled: false

  # Paths that should be crawled and fetched. Glob based paths.
  paths:
    - /var/log/*.log
    #- c:\programdata\elasticsearch\logs\*

  # Exclude lines. A list of regular expressions to match. It drops the lines that are
  # matching any regular expression from the list.
  # Line filtering happens after the parsers pipeline. If you would like to filter lines
  # before parsers, use include_message parser.
  #exclude_lines: ['^DBG']

  # Include lines. A list of regular expressions to match. It exports the lines that are
  # matching any regular expression from the list.
  # Line filtering happens after the parsers pipeline. If you would like to filter lines
  # before parsers, use include_message parser.
  #include_lines: ['^ERR', '^WARN']

  # Exclude files. A list of regular expressions to match. Filebeat drops the files that
  # are matching any regular expression from the list. By default, no files are dropped.
  #prospector.scanner.exclude_files: ['.gz$']

  # Optional additional fields. These fields can be freely picked
  # to add additional information to the crawled log files for filtering
  #fields:
  #  level: debug
  #  review: 1

# ============================== Filebeat modules ==============================

filebeat.config.modules:
  # Glob pattern for configuration loading
  #path: ${path.config}/modules.d/*.yml
  path: /etc/filebeat/modules.d/*.yml

  # Set to true to enable config reloading
  reload.enabled: false

  # Period on which files under path should be checked for changes
  #reload.period: 10s

# ======================= Elasticsearch template setting =======================

setup.template.settings:
  index.number_of_shards: 1
  index.number_of_replica: 0
  #index.codec: best_compression
  #_source.enabled: false


# ================================== General ===================================

# The name of the shipper that publishes the network data. It can be used to group
# all the transactions sent by a single shipper in the web interface.
#name:

# The tags of the shipper are included in their own field with each
# transaction published.
#tags: ["service-X", "web-tier"]

# Optional fields that you can specify to add additional information to the
# output.
#fields:
#  env: staging

# ================================= Dashboards =================================
# These settings control loading the sample dashboards to the Kibana index. Loading
# the dashboards is disabled by default and can be enabled either by setting the
# options here or by using the `setup` command.
#setup.dashboards.enabled: false

# The URL from where to download the dashboards archive. By default this URL
# has a value which is computed based on the Beat name and version. For released
# versions, this URL points to the dashboard archive on the artifacts.elastic.co
# website.
#setup.dashboards.url:

# =================================== Kibana ===================================

# Starting with Beats version 6.0.0, the dashboards are loaded via the Kibana API.
# This requires a Kibana endpoint configuration.
setup.kibana:

  # Kibana Host
  # Scheme and port can be left out and will be set to the default (http and 5601)
  # In case you specify and additional path, the scheme is required: http://localhost:5601/path
  # IPv6 addresses should always be defined as: https://[2001:db8::1]:5601
  #host: "localhost:5601"

  # Kibana Space ID
  # ID of the Kibana Space into which the dashboards should be loaded. By default,
  # the Default Space will be used.
  #space.id:

# =============================== Elastic Cloud ================================

# These settings simplify using Filebeat with the Elastic Cloud (https://cloud.elastic.co/).

# The cloud.id setting overwrites the `output.elasticsearch.hosts` and
# `setup.kibana.host` options.
# You can find the `cloud.id` in the Elastic Cloud web UI.
#cloud.id:

# The cloud.auth setting overwrites the `output.elasticsearch.username` and
# `output.elasticsearch.password` settings. The format is `<user>:<pass>`.
#cloud.auth:

# ================================== Outputs ===================================

# Configure what output to use when sending the data collected by the beat.

# ---------------------------- Elasticsearch Output ----------------------------
output.elasticsearch:
  # Array of hosts to connect to.
  hosts: ["localhost:9200"]

  # Protocol - either `http` (default) or `https`.
  #protocol: "https"

  # Authentication credentials - either API key or username/password.
  #api_key: "id:api_key"
  #username: "elastic"
  #password: "changeme"

# ------------------------------ Logstash Output -------------------------------
#output.logstash:
  # The Logstash hosts
  #hosts: ["localhost:5044"]

  # Optional SSL. By default is off.
  # List of root certificates for HTTPS server verifications
  #ssl.certificate_authorities: ["/etc/pki/root/ca.pem"]

  # Certificate for SSL client authentication
  #ssl.certificate: "/etc/pki/client/cert.pem"

  # Client Certificate Key
  #ssl.key: "/etc/pki/client/cert.key"

# ================================= Processors =================================
processors:
  - add_host_metadata:
      when.not.contains.tags: forwarded
  - add_cloud_metadata: ~
  - add_docker_metadata: ~
  - add_kubernetes_metadata: ~

# ================================== Logging ===================================

# Sets log level. The default log level is info.
# Available log levels are: error, warning, info, debug
#logging.level: debug

# At debug level, you can selectively enable logging only for some components.
# To enable all selectors use ["*"]. Examples of other selectors are "beat",
# "publisher", "service".
#logging.selectors: ["*"]

logging:
  level: info
  to_files: true
  to_syslog: false

# ============================= X-Pack Monitoring ==============================
# Filebeat can export internal metrics to a central Elasticsearch monitoring
# cluster.  This requires xpack monitoring to be enabled in Elasticsearch.  The
# reporting is disabled by default.

# Set to true to enable the monitoring reporter.
#monitoring.enabled: false

# Sets the UUID of the Elasticsearch cluster under which monitoring data for this
# Filebeat instance will appear in the Stack Monitoring UI. If output.elasticsearch
# is enabled, the UUID is derived from the Elasticsearch cluster referenced by output.elasticsearch.
#monitoring.cluster_uuid:

# Uncomment to send the metrics to Elasticsearch. Most settings from the
# Elasticsearch output are accepted here as well.
# Note that the settings should point to your Elasticsearch *monitoring* cluster.
# Any setting that is not set is automatically inherited from the Elasticsearch
# output configuration, so if you have the Elasticsearch output configured such
# that it is pointing to your Elasticsearch monitoring cluster, you can simply
# uncomment the following line.
#monitoring.elasticsearch:

# ============================== Instrumentation ===============================

# Instrumentation support for the filebeat.
#instrumentation:
    # Set to true to enable instrumentation of filebeat.
    #enabled: false

    # Environment in which filebeat is running on (eg: staging, production, etc.)
    #environment: ""

    # APM Server hosts to report instrumentation results to.
    #hosts:
    #  - http://localhost:8200

    # API Key for the APM Server(s).
    # If api_key is set then secret_token will be ignored.
    #api_key:

    # Secret token for the APM Server(s).
    #secret_token:


# ================================= Migration ==================================

# This allows to enable 6.7 migration aliases
#migration.6_to_7.enabled: true

I have also tried the following instructions. However, I am not getting the results I expect.

# rm -rf /usr/share/filebeat/bin/data
# /usr/share/filebeat/bin/filebeat setup -e
# /usr/share/filebeat/bin/filebeat -e
# curl -X GET "localhost:9200/_cat/indices?v"
health status index                           uuid                   pri rep docs.count docs.deleted store.size pri.store.size
green  open   .kibana_task_manager_7.12.0_001 l6hjy4tZRIu9wcoUl4jjdA   1   0          9       106366        9mb            9mb
green  open   .apm-custom-link                r_HoSa9hSd-gijfAxYzwUA   1   0          0            0       208b           208b
green  open   .apm-agent-configuration        cra6LMGVS3Kq4tMKUi-BhQ   1   0          0            0       208b           208b
green  open   .async-search                   4CPrJZ46QGqvCOuUWUjiRQ   1   0         22            0     11.7kb         11.7kb
green  open   .kibana-event-log-7.12.0-000001 WJWA9Y7gQiKAshPg47wNrQ   1   0          1            0      5.6kb          5.6kb
green  open   .kibana_7.12.0_001              w7QRQlypRFqEauGXuf-N6w   1   0        100           49      2.1mb          2.1mb
# curl -X GET "localhost:9200/_cat/indices?v"
health status index                                          uuid                   pri rep docs.count docs.deleted store.size pri.store.size
green  open   filebeat-7.12.0-else02-httpd-access-2022.08.02 I_rWmCFZTMCr4f8TGcK4zg   1   0          0            0       208b           208b
green  open   .kibana_task_manager_7.12.0_001                l6hjy4tZRIu9wcoUl4jjdA   1   0          9       106369        9mb            9mb
green  open   .apm-custom-link                               r_HoSa9hSd-gijfAxYzwUA   1   0          0            0       208b           208b
green  open   .apm-agent-configuration                       cra6LMGVS3Kq4tMKUi-BhQ   1   0          0            0       208b           208b
yellow open   filebeat-7.12.0-2022.08.02-000001              jUGcGI4hTX2pZF643ObQ2Q   1   1          0            0     71.5kb         71.5kb
green  open   .async-search                                  4CPrJZ46QGqvCOuUWUjiRQ   1   0         22            0     11.7kb         11.7kb
green  open   .kibana_7.12.0_001                             w7QRQlypRFqEauGXuf-N6w   1   0        100           49      2.1mb          2.1mb
green  open   .kibana-event-log-7.12.0-000001                WJWA9Y7gQiKAshPg47wNrQ   1   0          1            0      5.6kb          5.6kb

Of course, I included agent.version in nginx.yml here.

# vi /etc/filebeat/modules.d/nginx.yml
# Module: nginx
# Docs: https://www.elastic.co/guide/en/beats/filebeat/7.11/filebeat-module-nginx.html

- module: nginx
  # Access logs
  access:
    enabled: true

    # Set custom paths for the log files. If left empty,
    # Filebeat will choose the paths depending on your OS.
    var.paths: ["/var/log/nginx/access.log"]
    input.index: "filebeat-%{[agent.version]}-else02-httpd-access-%{+yyyy.MM.dd}"

  # Error logs
  error:
    enabled: true

    # Set custom paths for the log files. If left empty,
    # Filebeat will choose the paths depending on your OS.
    var.paths: ["/var/log/nginx/error.log"]
    input.index: "filebeat-%{[agent.version]}-else02-httpd-error-%{+yyyy.MM.dd}"

  # Ingress-nginx controller logs. This is disabled by default. It could be used in Kubernetes environments to parse ingress-nginx logs
  ingress_controller:
    enabled: false

    # Set custom paths for the log files. If left empty,
    # Filebeat will choose the paths depending on your OS.
    #var.paths:

The same problem still occurs even with the minimum configuration as you mentioned.

filebeat.config.modules:
  path: /etc/filebeat/modules.d/nginx.yml
  reload.enabled: false

setup.template.settings:
  index.number_of_shards: 1
  #index.number_of_replica: 0


setup.kibana:
  #host: "localhost:5601"

output.elasticsearch:
  hosts: ["localhost:9200"]


#logging:
#  level: info
#  to_files: true
#  to_syslog: false

Apologies I do not know what is not working with your setup

I just did this ... this is literally all I did.

  1. Completely fresh default install of Elasticsearch / Kibana 7.12.0
  2. Edited and combined filebeat.yml and nginx.yml into single minimal file see below.
  3. $ ./filebeat setup -e
  4. $ ./filebeat -e

Result

GET _cat/indices/file*?v

health status index                                   uuid                   pri rep docs.count docs.deleted store.size pri.store.size
yellow open   filebeat-7.12.0-2022.08.02-000001       Lg5TuGtcRwKYc7DN7YeXqQ   1   1          0            0       208b           208b
yellow open   filebeat-7.12.0-nginx-access-2022.08.02 hiiPnYcIRSOe3BoYn1PYMQ   1   1          7            0     36.1kb         36.1kb

This is my entire filebeat.yml (I combined them which is perfectly valid, to reduce variables)

filebeat.modules:
- module: nginx

  access:
    enabled: true
    input.index: "filebeat-%{[agent.version]}-nginx-access-%{+yyyy.MM.dd}"
    input.tags: ["customer-a"]
    var.paths: ["/Users/sbrown/workspace/sample-data/nginx/nginx-test.log"]

setup.template.settings:
  index.number_of_shards: 1

setup.kibana:

output.elasticsearch:
  hosts: ["localhost:9200"]

You have something going on... another .yml (this has happened to me before), your not using the .yml you think you are... bad syntax ... something ... or something is not default with the pipeline, alias something cluster etc.

I can provide my docker compose and test data if you like...

Something is also weird have you set some odd refresh rate I see even on the index you appear to be writing to 0 docs.. also 1 has 1 replica and the other 0... this leads me to believe there is something else going on... did you create your own templates or something with the same matching patterns... there could be conflict or the order they are applied.. something strange is going on

# curl -X GET "localhost:9200/_cat/indices?v"
health status index                                          uuid                   pri rep docs.count docs.deleted store.size pri.store.size
green  open   filebeat-7.12.0-else02-httpd-access-2022.08.02 I_rWmCFZTMCr4f8TGcK4zg   1   0          0            0       208b           208b
yellow open   filebeat-7.12.0-2022.08.02-000001              jUGcGI4hTX2pZF643ObQ2Q   1   1          0            0     71.5kb         71.5kb

technically looking very close there is 1 issue we would resolve and that is removing the ILM but that is not the cause of your issue...

it looks to me that filebeat is still writing to the write alias....

{
  "filebeat-7.12.0-2022.08.02-000001" : {
    "aliases" : {
      "filebeat-7.12.0" : {
        "is_write_index" : true
      }
    },

which means your filebeat is still writing to the default filebeat-7.12.0 why I am not sure.

@its-ogawa Think I may have found it!

I don't think this is correct / it is doing nothing.

How did you install?

If you installed via .deb or .rpm that is not the correct directory see here

data The location for persistent data files. /var/lib/filebeat

So your rm command is doing nothing and thus the data is not getting re-loaded.
it should be rm -rf /var/lib/filebeat/*

# rm -rf /var/lib/filebeat/*
# /usr/share/filebeat/bin/filebeat setup -e
# /usr/share/filebeat/bin/filebeat -e

Yes. I did indeed install using the rpm package.

What do you mean by persistent data files?
Is it meta.json?

I have both /var/lib/filebeat/meta.json and /usr/share/filebeat/bin/data/meta.json in my environment.

I have made a step forward.
The single minimal configuration file you created worked.

Current Status. I am able to reproduce the same situation as you.

# curl -X GET "210.148.155.195:9200/_cat/indices/file*?v"
health status index                                   uuid                   pri rep docs.count docs.deleted store.size pri.store.size
yellow open   filebeat-7.12.0                         GHo0AkwMR_metNn97AF00A   1   1          2            0     35.7kb         35.7kb
yellow open   filebeat-7.12.0-nginx-access-2022.08.03 jjrmhSTsQh6RmGiBcUwnSA   1   1          2            0     47.1kb         47.1kb

Here are a few questions.

  • Why is the index filebeat-7.12.0 being created?

    • I am intentionally creating the index input.index." filebeat-%{[agent.version]}-nginx-access-%{+yyyy.MM.dd}"!
    • Duplicate indexes are undesirable because they cut in half the number of indexes (number of shards) that can be maintained.
  • Why is the index.number_of_replica setting not enabled?

    • I intentionally choose not to create replicas (index.number_of_replica: 0).
    • This is undesirable because creating a replica halves the number of indexes (number of shards) that can be kept
# curl -X GET "210.148.155.195:9200/_cat/shards/file*?v"
index                                   shard prirep state      docs  store ip              node
filebeat-7.12.0-nginx-access-2022.08.03 0     p      STARTED       2 47.1kb XXX.XXX.XXX.XXX ELSTEST-01
filebeat-7.12.0-nginx-access-2022.08.03 0     r      UNASSIGNED
filebeat-7.12.0                         0     p      STARTED       2 35.7kb XXX.XXX.XXX.XXX ELSTEST-01
filebeat-7.12.0                         0     r      UNASSIGNED

That is fine if you want 0
replicas default is1

Something is not right with your installation. You shouldn't have both of those. I don't know if it's how you started it one time etc. I'm not sure if you have more than one installation. I'm not sure if you have one running in the background somewhere. Did you check? I don't know why. The behavior you are seeing is not normal... You're going to have to figure out what's Not correct.

If I were you I would try this.

You should clean up all the data files... In both locations, everything in the data directory and everything in All of it.

/var/lib/filebeat/
/usr/share/filebeat/bin/data

Leave my minimal filebeat.yml only...

Make sure all the files in the modules.d directory are disabled.

Then clean up the indices

Then start with system control

systemctl start filebeat

Something is not right with your installation... Or the way you're starting this or something?.

I have reinstalled Filebeat.

In the configuration of #34, The problem of not being able to retrieve documents as shown in #22 does not currently occur.

However, there are index and replica issues as shown in #37.

What about this?

@its-ogawa Apologies I have no answer.... I can not replicate the issue.
Check your PM.