Hello everyone, I'm new to the making of dashboards and now I'm having a bit of problem dealing with a specific field on Lens.
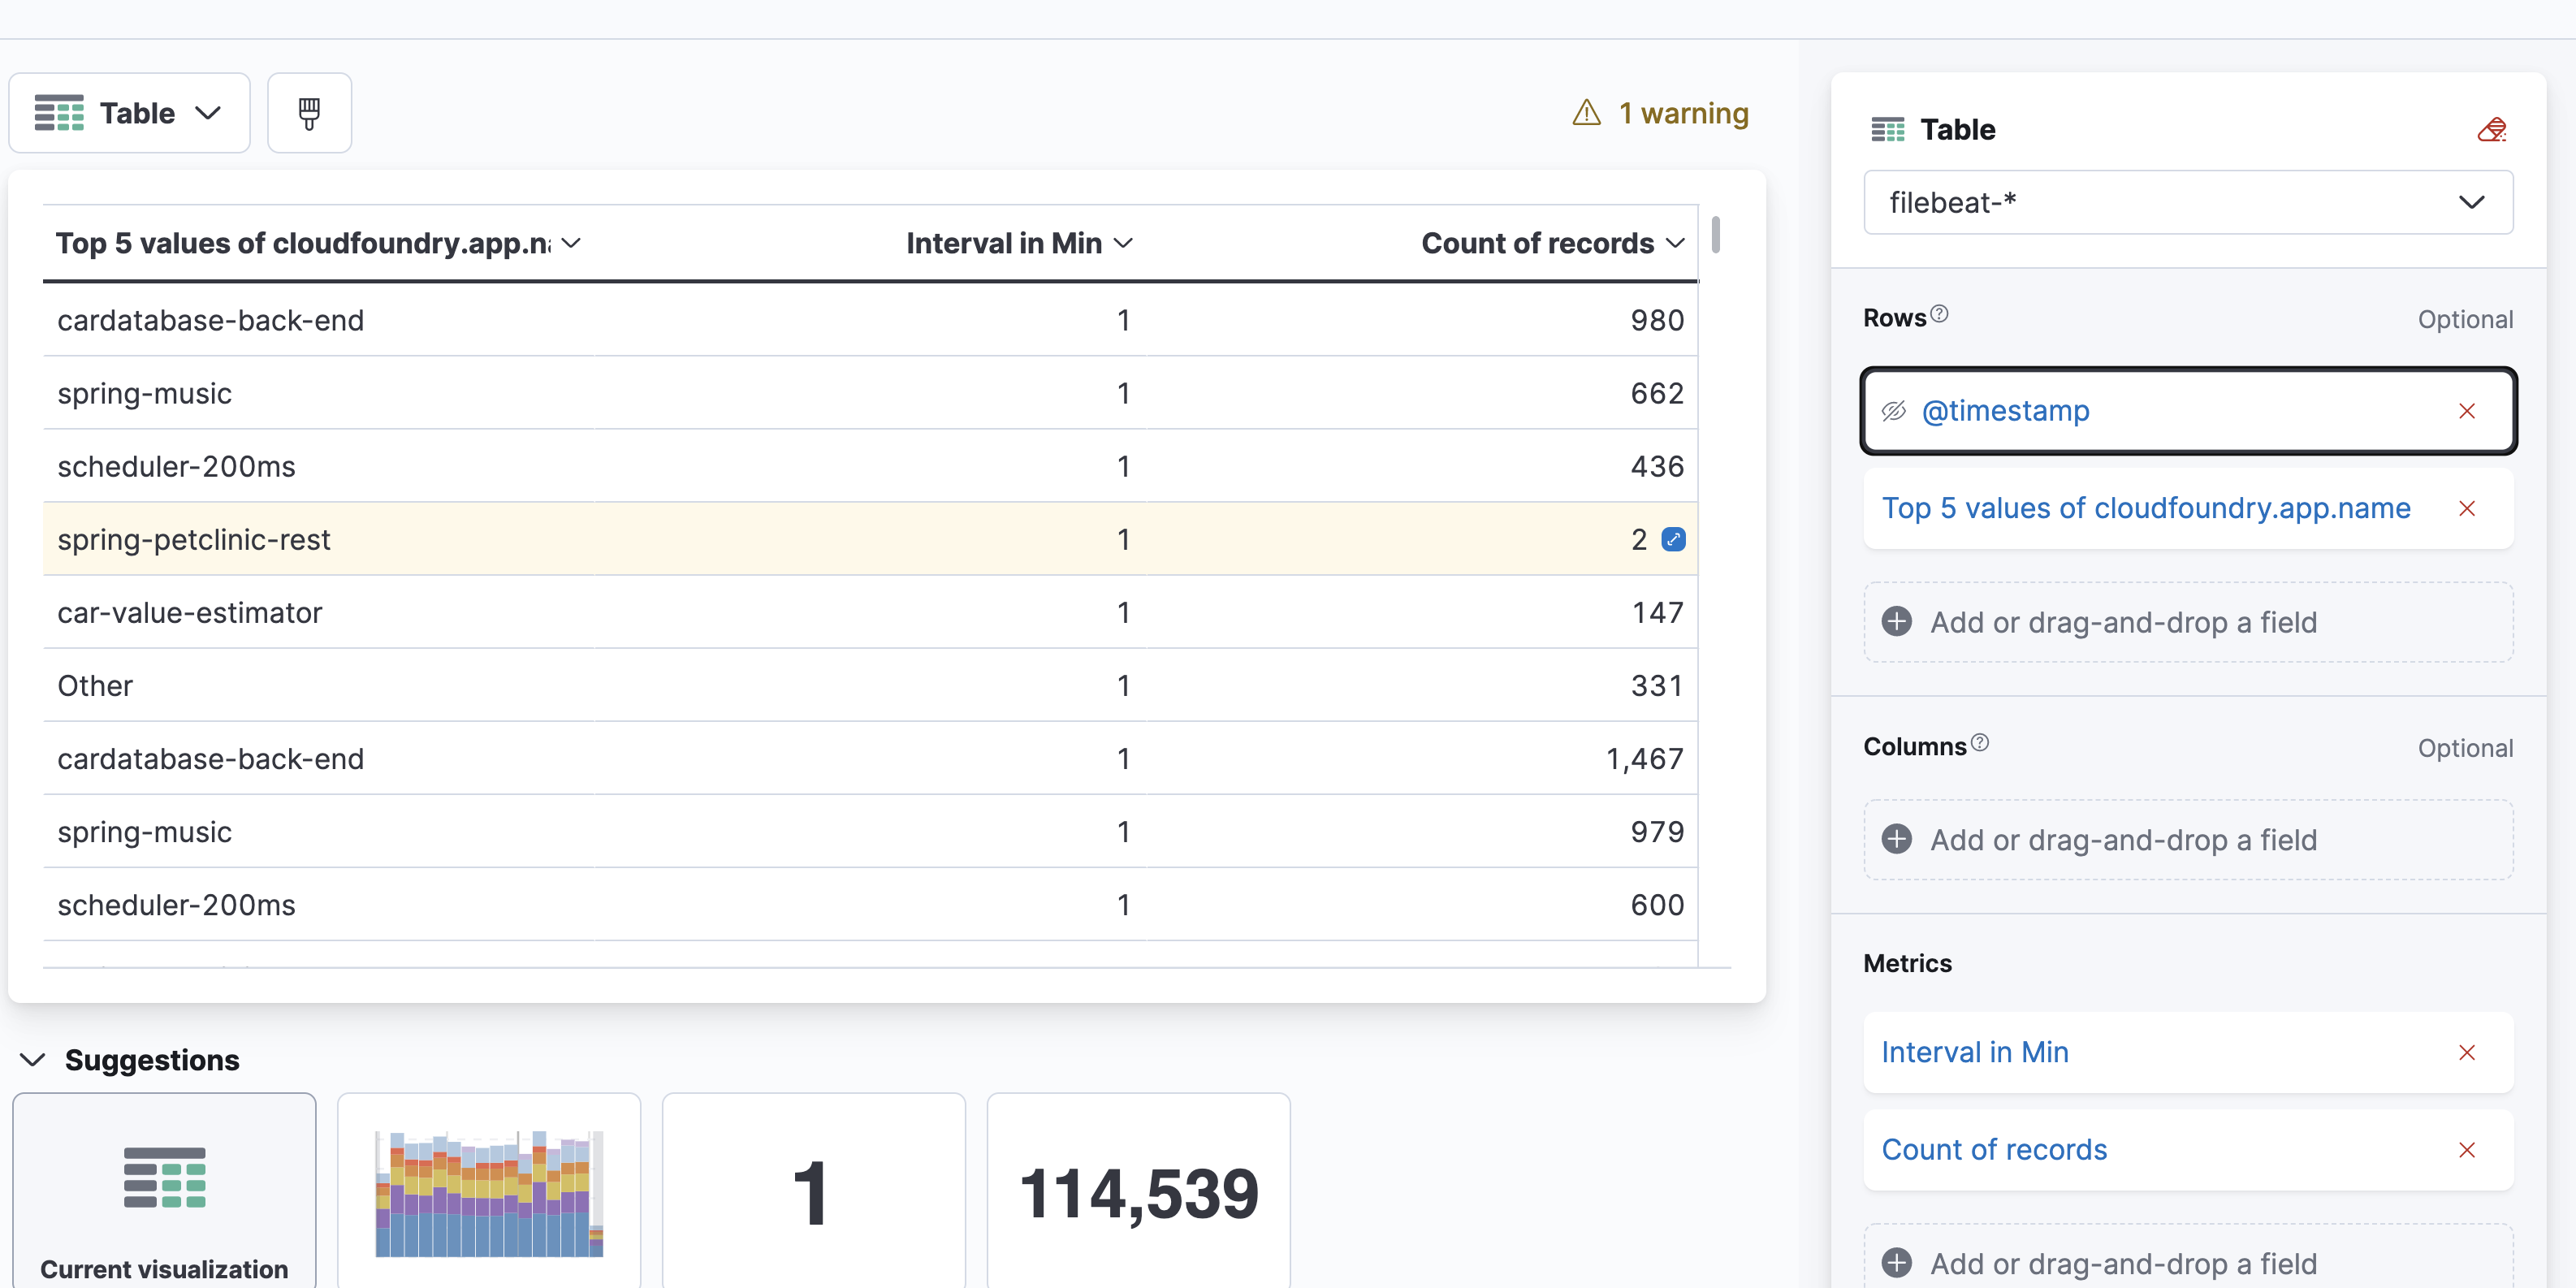
First here is the image in question:

On the left is a random ID given to a device and on the right is the minute the log of disconection was made.
What I am looking for is a way to only show the interval of such events, so in the example up there would be only:
RQ8M602HR8H and 1minute (since that is the time of the interval).
I'm not sure if there is a already built-in function for that. I know that canvas has a great support for SQL which is nice for cases like this but have yet to see something similar on Dashboards. In any case I'll be glad if there is anyone who can help on that problem, best regards!